Bears are fully in control of S&P 500 market
S&P 500 Price Analysis – 26 September
If the $4348 level is held, the price may continue to move in the direction of the support levels of $4276, $4181, and $4091. Price may rise to the $4434 barrier level and then continue to rise until it hits $4529 if the $4348 resistance level is breached
Key Levels:
Resistance levels: $4348, $4434, $4529
Support levels: $4276, $4181, $4091
S&P 500 Long-term trend: Bearish
On the daily chart, the S&P 500 is trending downward. The S&P market’s pricing was in the hands of buyers last month. The bullish trend passed through the $4276 resistance level and peaked at $4606 level when there was buying pressure. The euphoria of the bulls was diminished by the sellers’ defense of the $4606 resistance. S&P 500 dropped and again tested $4334 as support. At that point, the sellers’ pressure was ineffectual. The bears are now in charge of the market and are pushing it toward $4276.
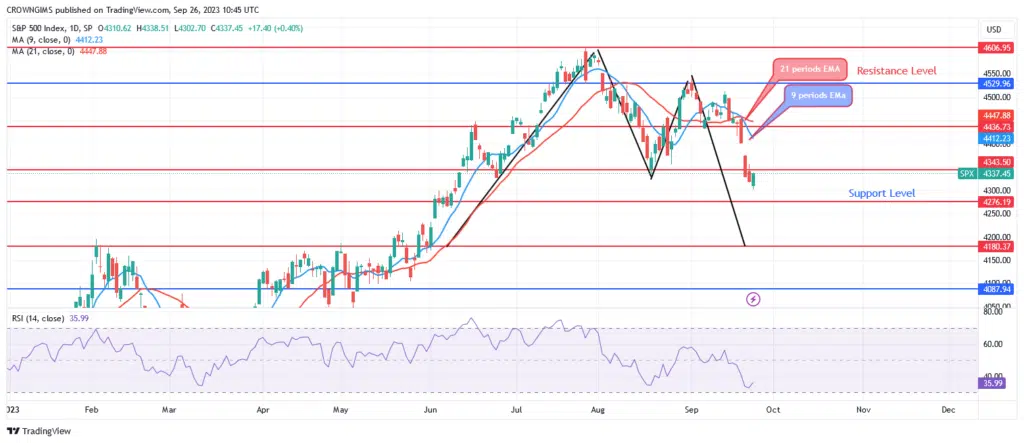
If the $4348 level is held, the price may continue to move in the direction of the support levels of $4276, $4181, and $4091. The relative strength index value of 35 for period 14 and the signal line’s downward trend both represent a selling indication. Price may rise to the $4434 barrier level and then continue to rise until it hits $4529 if the $4348 resistance level is breached.
S&P 500 Medium-term Trend: Bearish
S&P 500’s 4-hour chart shows a declining trend. The sellers were successful in stopping the S&P 500’s price from dramatically climbing over the preceding three weeks by maintaining the $4529 barrier level. As soon as it surpassed the $4348 barrier level, consumer demand rose and the price began to fall. As the price dropped, the psychological ceiling of $4276 came into view. Price could drop below just mentioned level.

The price of the S&P 500 is currently below both the exponential moving averages of nine and twenty-one periods. At level 33, the Relative Strength Index period 14 exhibits a bullish signal that could foreshadow a pullback.
You can purchase Lucky Block here. Buy LBLOCK