Bulls intensify more pressure in S&P 500 market
S&P 500 Price Analysis – 27 January
If the price falls below the $6757 support level, it can move toward the $6589 and $6473 levels. Both the Hull Suite cryptocurrency signals and the QQE MOD histogram indicate potential buying opportunities. The overall sentiment of the market might get better.
Key Levels:
Resistance levels: $6906, $6950, $7020
Support levels: $6757, $6589, $6473
S&P 500 Long-term trend: Bullish
On its daily chart, the S&P 500 Index is presently showing an upward trend. Bullish circumstances have ruled the market for the past three months. Price rises have been the main driver of the index since February 19. Another attempt to reach the $6757 mark was made on September 6, and it was successful this time.
The Fed and Important Earnings Are Coming Up This Week.
Big Week Ahead with Fed and Key Earnings https://t.co/dv7278RQcV pic.twitter.com/rb3eub1Awy
— S&P 500 Signals (@SPYSTSignals) January 24, 2026
First off, my 2026 Outlook is available here if you missed it. The stock categories listed as 2026 winners have been dominating the S&P and QQQ index since I published it. You will need to log onto Substack to read the entire piece because it is too lengthy for email, but it won’t be too hard.
The price was able to briefly settle at the beginning level in order to halt additional upward progress. At $6950, the double-top bearish reversal pattern might not hold. From $6155 to the critical resistance level of $6906, the S&P 500 has risen. However, the price is still moving toward its previous peak.
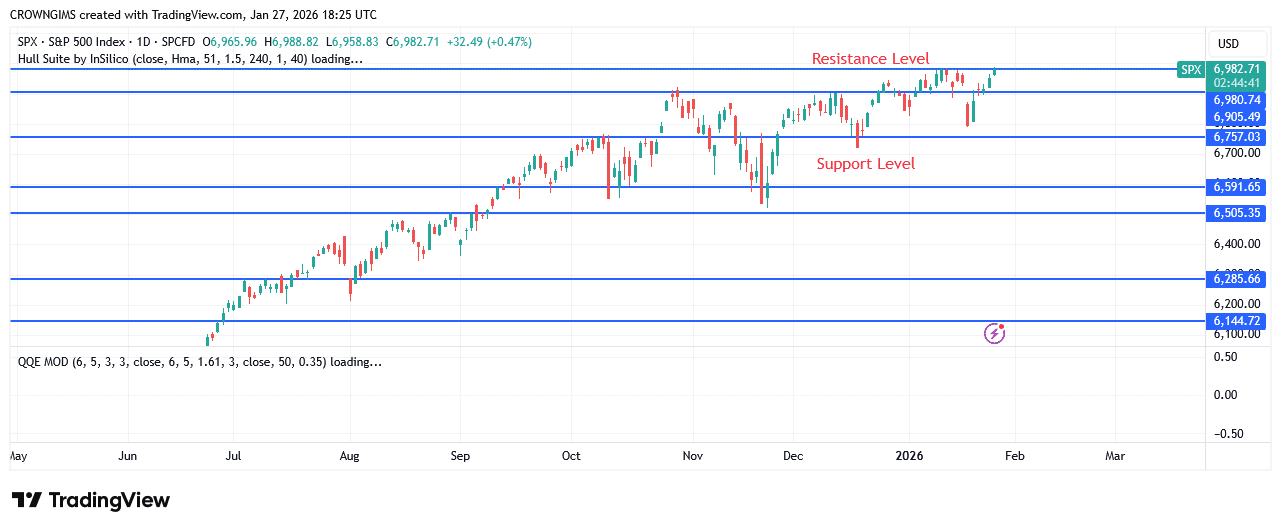
The resistance levels of $6906, $6950, and $7020 could be reached by the S&P 500. This forecast is based on the $6757 level remaining stable. If the price falls below the $6757 support level, it can move toward the $6589 and $6473 levels. Both the Hull Suite cryptocurrency signals and the QQE MOD histogram indicate potential buying opportunities. The overall sentiment of the market might get better.
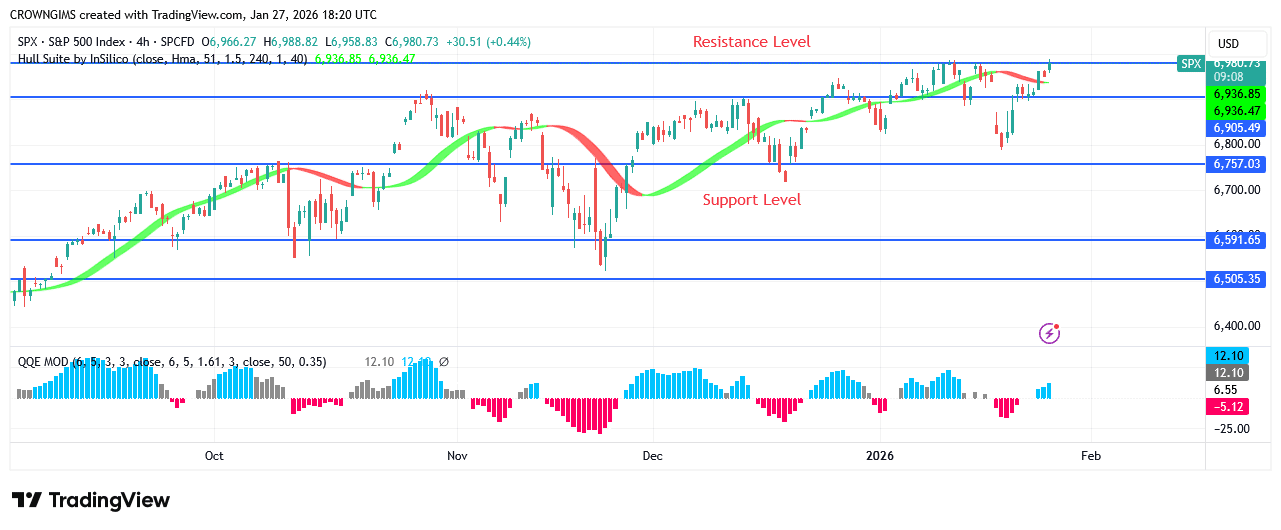
S&P 500 Medium-term Trend: Bullish
The 4-hour chart of the S&P 500 shows an upward trend. Over the previous week, strong bullish support has kept the price from advancing beyond $6906. Despite a steady rise, the bulls have held onto their positions. However, the price is currently moving quickly in the direction of $6906 due to an engulfing candlestick pattern. The value of the S&P 500 has been increasing since it recovered from the $6757 level.
Start using a world-class auto trading solution
You can purchase Lucky Block here. Buy LBLOCK
- Broker
- Min Deposit
- Score
- Visit Broker

- Award-winning Cryptocurrency trading platform
- $100 minimum deposit,
- FCA & Cysec regulated

- 20% welcome bonus of upto $10,000
- Minimum deposit $100
- Verify your account before the bonus is credited
- Fund Moneta Markets account with a minimum of $250
- Opt in using the form to claim your 50% deposit bonus
Learn to Trade
Never Miss A Trade Again

Signal Notification
Real-time signal notifications whenever a signal is opened, closes or Updated

Get Alerts
Immediate alerts to your email and mobile phone.

Entry Price Levels
Entry price level for every signal Just choose one of our Top Brokers in the list above to get all this free.