Bulls’ pressure may increase
S&P 500 Price Analysis – 19 August
The S&P 500 may touch the resistance levels of $6474, $6484, and $6500. This is assuming that the $6300 position stays steady. The price may test the $6232 and $6151 possibilities if it breaches the $6300 support level.
Key Levels:
Resistance levels: $6474, $6484, $6500
Support levels: $6300, $6232, $6151
S&P 500 Long-term trend: Bullish
The S&P 500 Index’s daily chart indicates an increasing trend. The market has been dominated by bulls for more than two months. Since February 19, the indicator’s primary driver has been subtractions. Another attempt to attain the $6300 milestone was attempted on June 18; the request was approved, more visits were carried out. The buyers were able to temporarily halt more price falls by maintaining the fixed price at the initial suggested position, and the double-bottom bullish reversal map pattern remained stable at $6232. The S&P 500 increased from $6151 to the $6300 barrier level. The price is currently increasing and getting close to $6474.
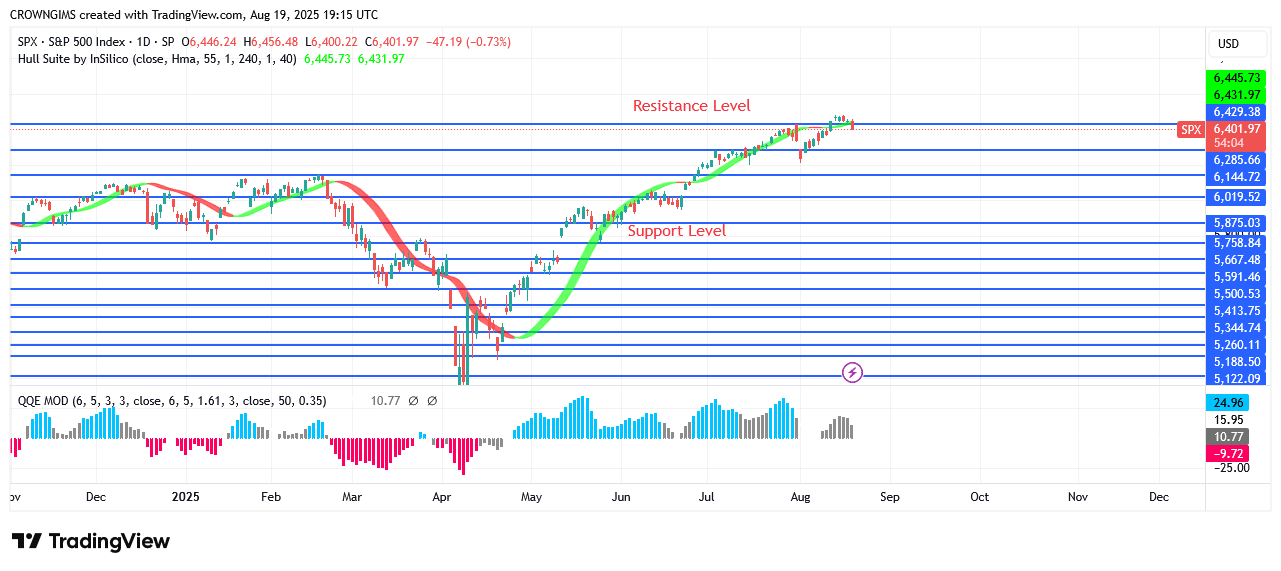
The S&P 500 may touch the resistance levels of $6474, $6484, and $6500. This is assuming that the $6300 position stays steady. The price may test the $6232 and $6151 possibilities if it breaches the $6300 support level. Both the Hull Suite crypto signals and the QQE MOD histogram point to a purchase. It may all go according to plan.
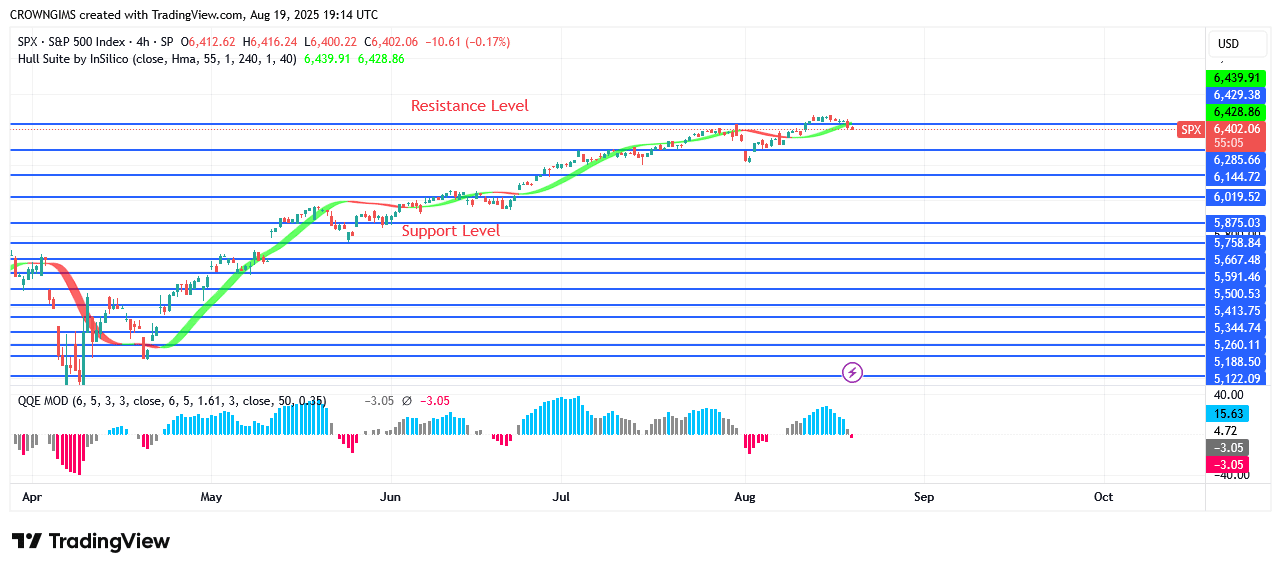
S&P 500 Medium-term Trend: Bullish
The 4-hour plot of the S&P 500 shows an increasing trend. For the first week, the price has not fallen below the $6232 hedge position due to the bulls’ robust support. As the price has been rising, the bulls have stayed steady at their assigned levels. An engulfing candle pattern is causing the price to rise quickly toward $6474. The S&P 500 has been increasing in value ever since it recovered from $6232.
Start using a world-class auto trading solution
You can purchase Lucky Block – Guide, Tips & Insights | Learn 2 Trade here. Buy LBLOCK
- Broker
- Min Deposit
- Score
- Visit Broker

- Award-winning Cryptocurrency trading platform
- $100 minimum deposit,
- FCA & Cysec regulated

- 20% welcome bonus of upto $10,000
- Minimum deposit $100
- Verify your account before the bonus is credited
- Fund Moneta Markets account with a minimum of $250
- Opt in using the form to claim your 50% deposit bonus
Learn to Trade
Never Miss A Trade Again

Signal Notification
Real-time signal notifications whenever a signal is opened, closes or Updated

Get Alerts
Immediate alerts to your email and mobile phone.

Entry Price Levels
Entry price level for every signal Just choose one of our Top Brokers in the list above to get all this free.