Sellers are defending $4606 level
S&P 500 Price Analysis – 05 December
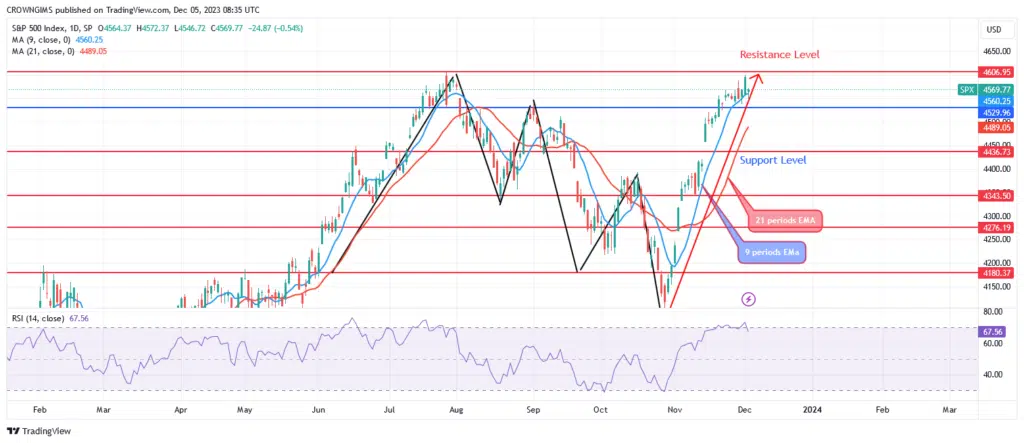
If the $4532 level is held, the S&P 500 might rise sharply into the resistance levels of $4606, $4723, and $4813. Both the signal line’s inclining trend and the period 14 relative strength index’s 67 rating suggest a buy. The total expense can exceed $4606 in total
Key Levels:
Resistance levels: $4606, $4723, $4813
Support levels: $4532, $4437, $4345
S&P 500 Long-term trend: Bullish
The S&P 500 Index is rising. Prices on the S&P market were set by sellers until October 27. A bullish reversal was signaled by the “W” chart pattern near the $4087 barrier level. On October 30, buying pressure caused the price to test and break up $4345. The purchasers held the newly formed support level; the S&P 500 surges to new heights as the price trend breaks above the $4437 and $4532 levels. It is currently exposed to the $4606 level.
If the $4532 level is held, the S&P 500 might rise sharply into the resistance levels of $4606, $4723, and $4813. Both the signal line’s inclining trend and the period 14 relative strength index’s 67 rating suggest a buy. The total expense can exceed $4606 in total.
S&P 500 Medium-term Trend: Bullish
The four-hour chart of the S&P 500 is showing hints of strength. The price is rising over the $4606 resistance level due to the double bottom chart pattern that appeared below the $4180 support level. The bulls have clung to the previously set level as the price rises. The current price objective is $4606.00, as indicated by the bullish engulfing candle that emerged last week.

The cost of the 21- and 9-period EMAs is lower than that of the S&P 500. A bullish signal at 62 indicates that period 14 of the Relative Strength Index is rising.
You can purchase Lucky Block – Guide, Tips & Insights | Learn 2 Trade here. Buy LBLOCK
- Broker
- Min Deposit
- Score
- Visit Broker

- Award-winning Cryptocurrency trading platform
- $100 minimum deposit,
- FCA & Cysec regulated

- 20% welcome bonus of upto $10,000
- Minimum deposit $100
- Verify your account before the bonus is credited
- Fund Moneta Markets account with a minimum of $250
- Opt in using the form to claim your 50% deposit bonus
Learn to Trade
Never Miss A Trade Again

Signal Notification
Real-time signal notifications whenever a signal is opened, closes or Updated

Get Alerts
Immediate alerts to your email and mobile phone.

Entry Price Levels
Entry price level for every signal Just choose one of our Top Brokers in the list above to get all this free.