S&P 500 may increase further
S&P 500 Price Analysis – 13 January
The resistance levels of $6906, $6950, and $7020 could be reached by the S&P 500. This forecast is based on the $6757 level remaining intact. If the price falls below the $6757 support level, it may move toward the $6589 and $6473 levels.
Key Levels:
Resistance levels: $6906, $6950, $7020
Support levels: $6757, $6589, $6473
S&P 500 Long-term trend: Bullish
On its daily chart, the S&P 500 Index is currently showing an upward trend. Bullish conditions have been dominant in the market over the past three months. A series of higher price movements has been the main driver for the index since February 19. Another attempt to reach the $6757 level was made on September 6, and this time it was successful. The price was able to temporarily stabilize at the initial level, preventing further upward movement. At $6950, the double-top bearish reversal pattern might not hold. From $6155 to the key resistance level of $6906, the S&P 500 has risen. However, the price is still moving towards its previous high.
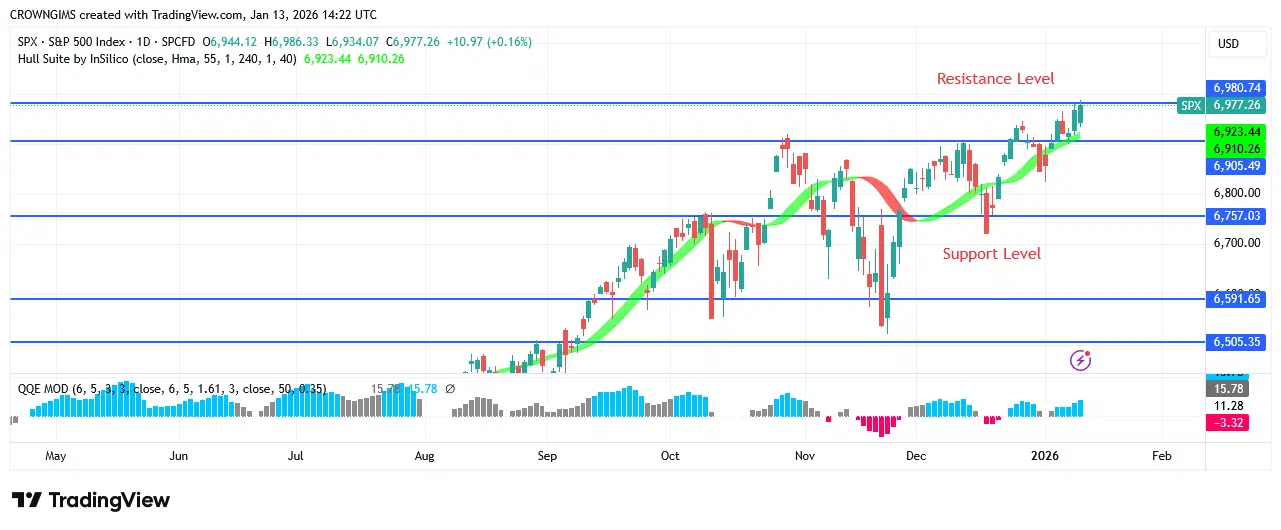
The resistance levels of $6906, $6950, and $7020 could be reached by the S&P 500. This forecast is based on the $6757 level remaining intact. If the price falls below the $6757 support level, it may move toward the $6589 and $6473 levels. Both the Hull Suite cryptocurrency signals and the QQE MOD histogram indicate potential buying opportunities. The overall market sentiment might improve.
S&P 500 Medium-term Trend: Bullish
The 4-hour chart of the S&P 500 shows an upward trend. For the past week, the price has struggled to rise above the $6906 level due to strong bullish support. Despite a steady rise, the bulls have held their positions. However, the price is currently moving quickly towards the $6906 level due to an engulfing candlestick pattern.he value of the S&P 500 has been increasing since it recovered from the $6757 level. 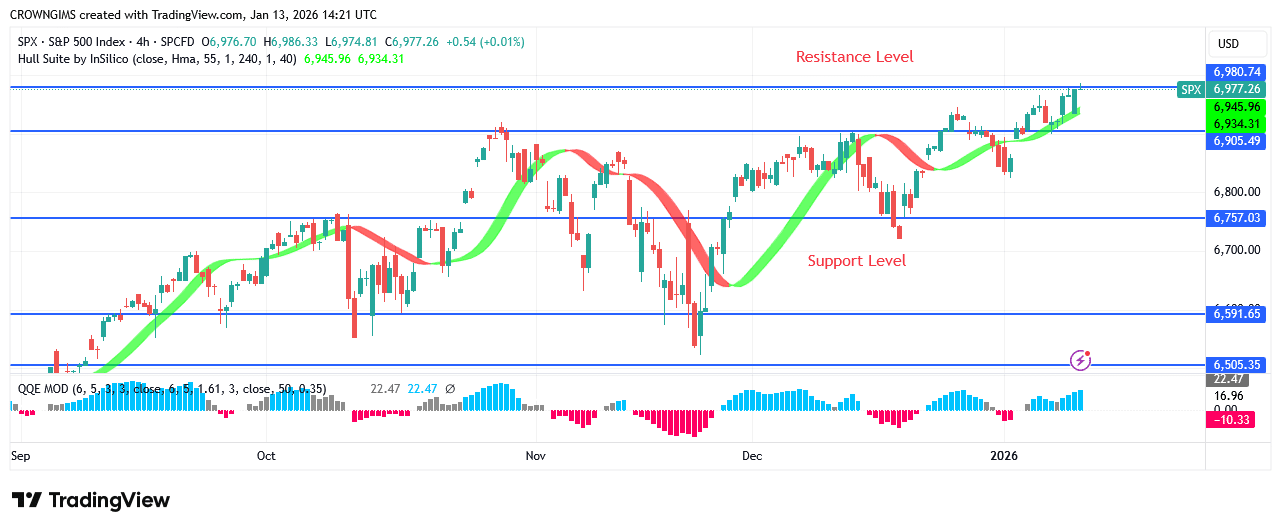
At the moment, the Hull Suite is cheaper than the S&P 500. A strong buying signal is generated when the QQE MOD index crosses above zero.
Start using a world-class auto trading solution
You can purchase Lucky Block here. Buy LBLOCK
- Broker
- Min Deposit
- Score
- Visit Broker

- Award-winning Cryptocurrency trading platform
- $100 minimum deposit,
- FCA & Cysec regulated

- 20% welcome bonus of upto $10,000
- Minimum deposit $100
- Verify your account before the bonus is credited
- Fund Moneta Markets account with a minimum of $250
- Opt in using the form to claim your 50% deposit bonus
Learn to Trade
Never Miss A Trade Again

Signal Notification
Real-time signal notifications whenever a signal is opened, closes or Updated

Get Alerts
Immediate alerts to your email and mobile phone.

Entry Price Levels
Entry price level for every signal Just choose one of our Top Brokers in the list above to get all this free.