Bulls’ pressure increase on $4875 level
S&P 500 Price Analysis – 23 January
If the $4800 level is held, the S&P 500 may go swiftly into the resistance levels of $4875, $4966, and $5000. Both the QQE MOD histogram and the Hull Suite indicator suggest a buy. Total spending can be more than $4875.
Key Levels:
Resistance levels: $4875, $4966, $5000
Support levels: $4800, $4678, $4599
S&P 500 Long-term trend: Bullish
The S&P 500 Index is rising on the daily chart. Sellers forced the price down to the $4095 support level on October 27. The creation of a bullish engulfing candle started the bullish trend. S&P market surpasses $4493 and $4599. After then, it starts to ascend northward. The pattern of the “W” chart indicated a bullish reversal close to the $4802 barrier level. On December 13, buying pressure caused the price to test and break over $4678. The buyers maintained their hold on the recently established support level, and the S&P 500 hit all-time highs of $4875 resistance level.
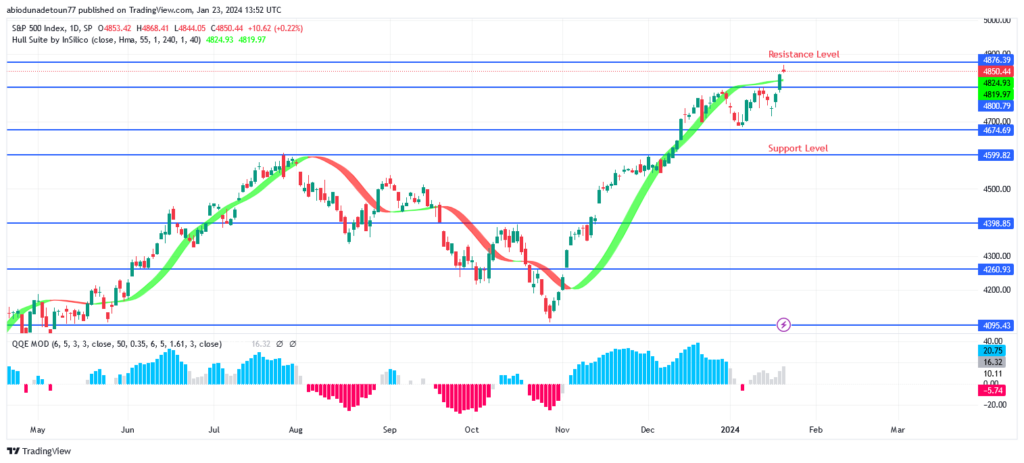
If the $4800 level is held, the S&P 500 may go swiftly into the resistance levels of $4875, $4966, and $5000. Both the QQE MOD histogram and the Hull Suite indicator suggest a buy. Total spending can be more than $4875.
S&P 500 Medium-term Trend: Bullish
The four-hour chart of the S&P 500 shows encouraging hints. Price is rising above the $4674 resistance level due to the bulls’ strong momentum above the $4599 support level. The bulls have clung to the previously set level as the price has increased. Yesterday’s bullish engulfing candle shows that the current price target of $4875 has been reached.
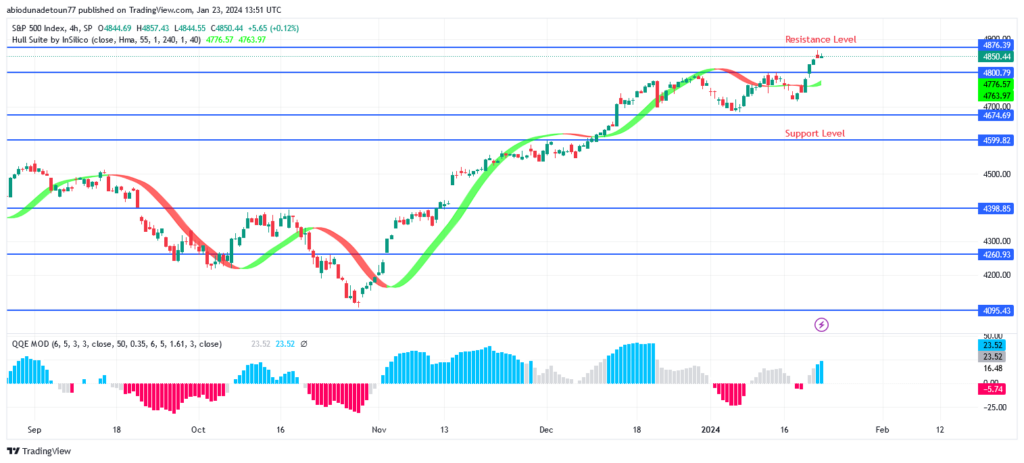
Compared to the S&P 500, the Hull Suite indication is less expensive. The QQE MOD indicator is above zero, indicating a buy signal.
You can purchase Lucky Block – Guide, Tips & Insights | Learn 2 Trade here. Buy LBLOCK
- Broker
- Min Deposit
- Score
- Visit Broker

- Award-winning Cryptocurrency trading platform
- $100 minimum deposit,
- FCA & Cysec regulated

- 20% welcome bonus of upto $10,000
- Minimum deposit $100
- Verify your account before the bonus is credited
- Fund Moneta Markets account with a minimum of $250
- Opt in using the form to claim your 50% deposit bonus
Learn to Trade
Never Miss A Trade Again

Signal Notification
Real-time signal notifications whenever a signal is opened, closes or Updated

Get Alerts
Immediate alerts to your email and mobile phone.

Entry Price Levels
Entry price level for every signal Just choose one of our Top Brokers in the list above to get all this free.