

Buyers are holding onto S&P 500 market
S&P 500 Price Analysis – 27 August
If the $5580 level holds, the S&P 500 can rise and split into the resistance levels of $5667, $5765, and $6005. The $5500 and $5418 support levels may be tested by the price if the $5580 support level is shattered.
Key Levels:
Resistance levels: $5667, $5765, $6005
Support levels: $5580, $5500, $5418
S&P 500 Long-term trend: Bullish
The S&P 500 Index’s daily chart indicates an upward trend. Since August 5th, acquisitions have been the main driver of the index. On August 13th, there was another attempt to break through the $5500 barrier. This project was close to being approved. The buyers stopped further price declines by adhering to the predetermined prices, which currently stands at $5,667. The buyers are targeting price increases above $5580, which would take them closer to the previous peak.
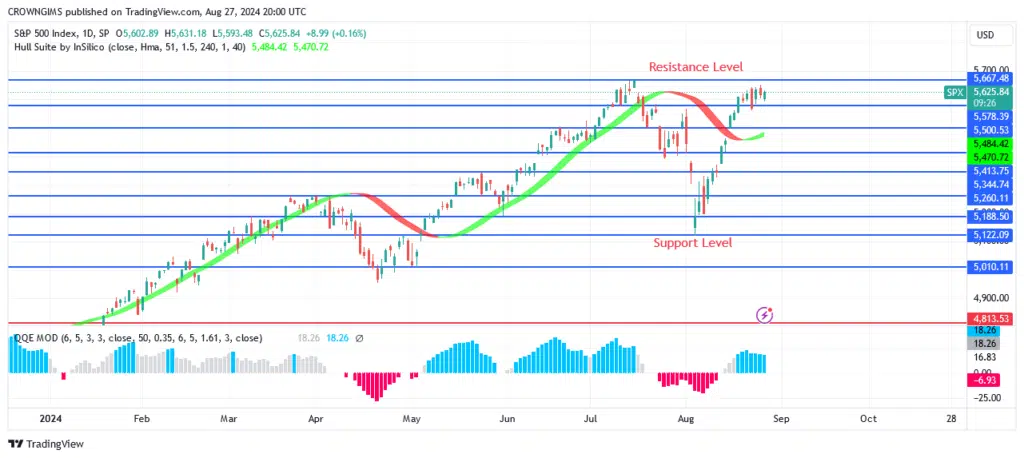
If the $5580 level holds, the S&P 500 can rise and split into the resistance levels of $5667, $5765, and $6005. The $5500 and $5418 support levels may be tested by the price if the $5580 support level is shattered. Both the Hull Suite crypto signals and the QQE MOD histogram suggest a buy. Maybe it will keep going in the right direction.
S&P 500 Medium-term Trend: Bullish

Start using a world-class auto trading solution
You can purchase Lucky Block here. Buy LBLOCK


