

Bullish pressure may further increase in S&P 500 market
S&P 500 Price Analysis – 18 January
In case the buying pressure picks up, the S&P 500 may breach the $4139 resistance level, and more pressure from the buyers could drive the price up to $4330 and $4586 levels. Price may reverse and decline toward the support levels of $3914, $786, and $4169 if the resistance level of $4139 holds.
Key levels:
Resistance levels: $4139, $4330, $4586
Support levels: $3914, $3786, $3559
S&P 500 Long-term trend: Bullish
On the daily chart, the S&P 500 is on the bullish movement. Buyers pushed the price higher to the resistance level at $4139 on 13 December. The bullish momentum could not penetrate the barrier at the just-mentioned level. An inverted pin bar formed at the level. The price declines towards the $3651 level but could not reach the mark before buyers opposed the bearish movement. Last week, the resistance level of $3914 was broken upside, and the price currently facing $4139 level.
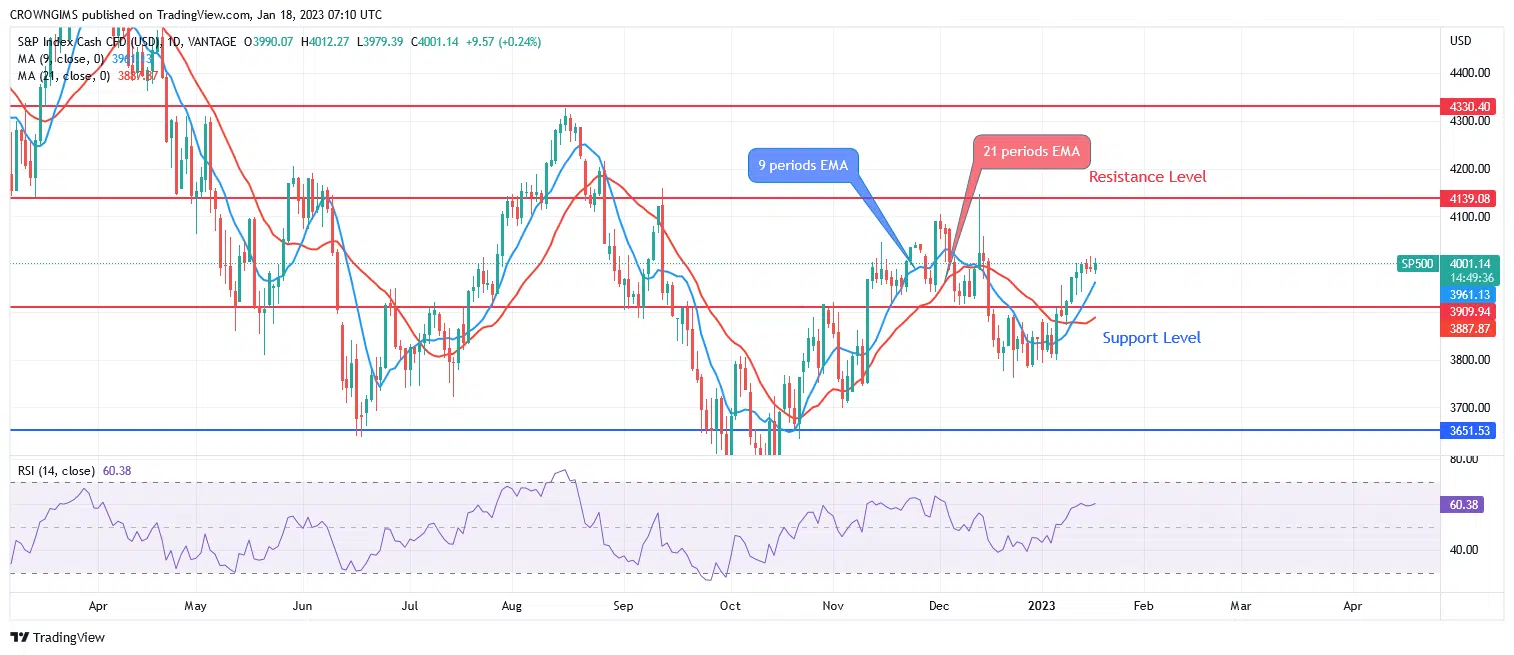
The S&P 500 is trading above both the 9- and 21-period exponential moving averages, which point to a bullish momentum. In case the buying pressure picks up, the S&P 500 may breach the $4139 resistance level, and more pressure from the buyers could drive the price up to $4330 and $4586 levels. Price may reverse and decline toward the support levels of $3914, $786, and $4169 if the resistance level of $4139 holds. With the signal line heading upward and the relative strength index period 14 at 60, a buy signal is being indicated.
S&P 500 Medium-term Trend: Bullish
The 4-hour chart’s forecast indicates that the S&P 500 is heading upward. When the price tested the $3786 support level, the strength of the sellers weakened. In the 4-hour, it began trading fluctuations. When the bulls got more traction, the price began to rise upward. Price is currently targeting the resistance level of $4139.

S&P 500 is trading above both the 9- and 21-period exponential moving averages, the price is heading upward. The Relative Strength Index period 14 at 59 levels display a bullish signal.
You can purchase Lucky Block here. Buy LBLOCK


