Bullish pressure increases in S&P 500 market
S&P 500 Price Analysis – 22 November
An increase in the momentum of the buyers may increase S&P 500 to a resistance level of $4139, and a further increase is envisaged towards $4330 and $4586 levels. Below the price at the moment are support levels at $3886, $3651, and $3559.
Key levels:
Resistance levels: $4139, $4330, $4586
Support levels: $3886, $3651, $3559
S&P 500 Long-term trend: Bullish
S&P 500 is bullish on the daily chart. There was no significant movement in the S&P 500 market last week. When the price action formed a chart pattern called a long “W” on the daily chart in the S&P 500 market. The bullish trend was triggered and the resistance levels of $3651 and $3886 were broken upside. The price is currently exposed to the resistance level of $4139.
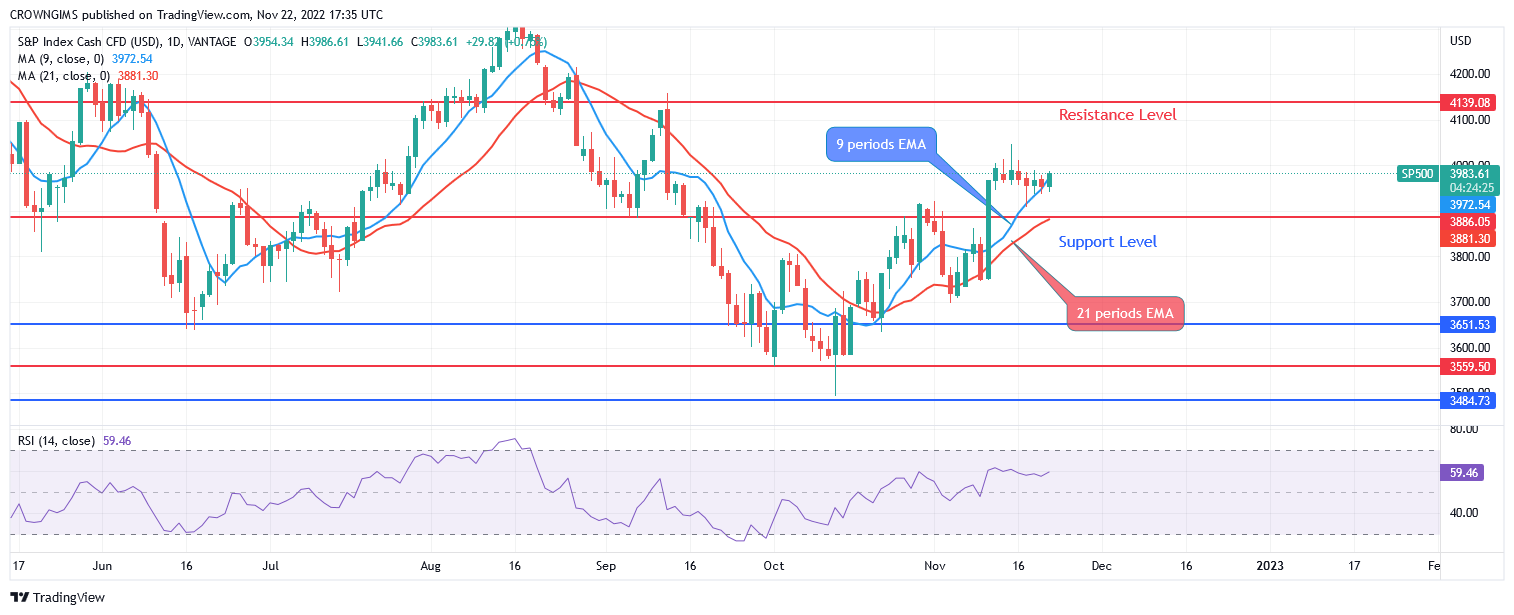
S&P 500 is trading above the 9-periods EMA and the 21-period EMA which indicates an increase in the buyers’ momentum. An increase in the momentum of the buyers may increase S&P 500 to a resistance level of $4139, and a further increase is envisaged towards the $4330 and $4586 levels. Below the price at the moment are support levels at $3886, $3651, and $3559. The relative strength index period 14 is at 59 levels with the signal lines pointing up to indicate a buy signal.
S&P 500 Medium-term Trend: Bullish
On the 4-hour chart outlook, S&P 500 is on a bullish movement. After the formation of the bullish chart pattern called Double bottom in the 4-hour time frame. The price bounced off the support level of $3559 level. It increases towards the north and it is currently targeting the resistance level of $4139.
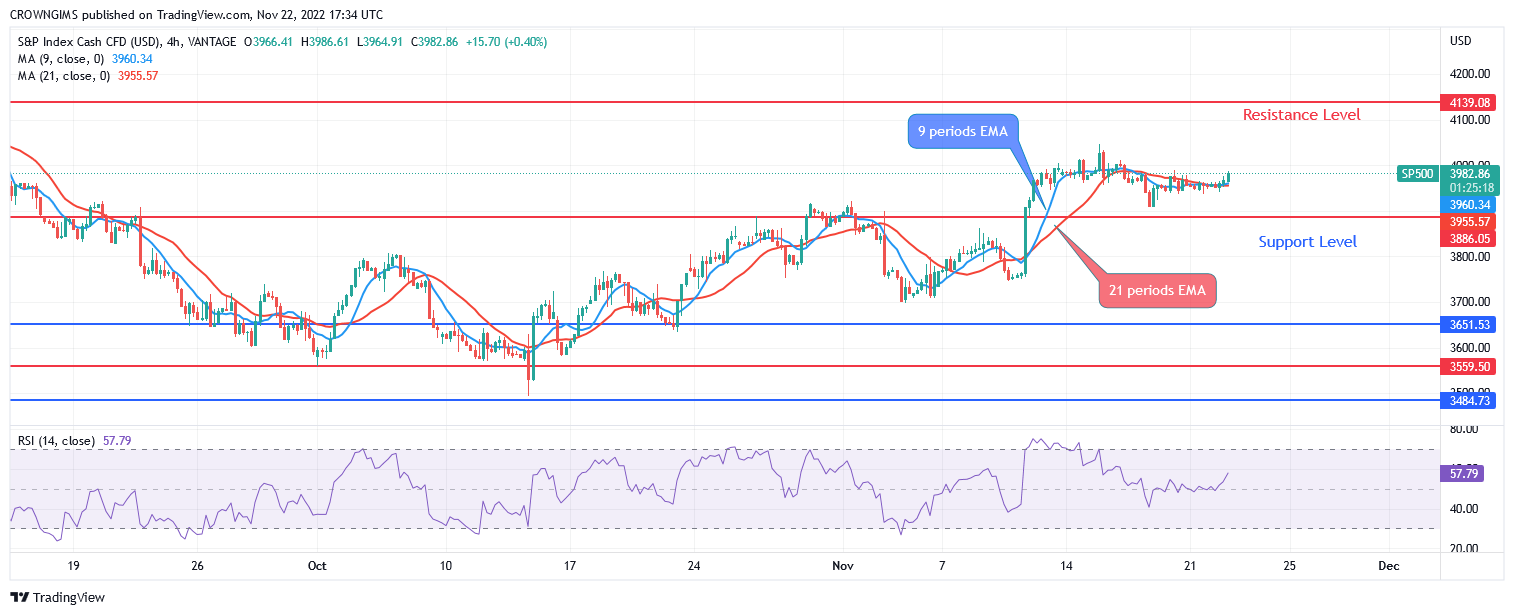
The price is trading above the 9-periods EMA and 21-periods EMA as an indication of bullish movement. The relative strength index period 14 is at 57 levels displaying a bullish signal.
You can purchase Lucky Block – Guide, Tips & Insights | Learn 2 Trade here. Buy LBLOCK
- Broker
- Min Deposit
- Score
- Visit Broker

- Award-winning Cryptocurrency trading platform
- $100 minimum deposit,
- FCA & Cysec regulated

- 20% welcome bonus of upto $10,000
- Minimum deposit $100
- Verify your account before the bonus is credited
- Fund Moneta Markets account with a minimum of $250
- Opt in using the form to claim your 50% deposit bonus
Learn to Trade
Never Miss A Trade Again

Signal Notification
Real-time signal notifications whenever a signal is opened, closes or Updated

Get Alerts
Immediate alerts to your email and mobile phone.

Entry Price Levels
Entry price level for every signal Just choose one of our Top Brokers in the list above to get all this free.