S&P 500 Price Analysis – September 20
In case the support level of $3740 is defended by the bulls, price may face resistance levels at $3927, $4087 and $4169. S&P 500 may test support level at $3740 level, and further decrease to $3640 support level.
Key levels:
Resistance levels: $3927, $4087, $4169
Support levels: $3740, $3640, $3524
S&P 500 Long-term trend: Bearish
S&P 500 is bearish on the daily chart. The sellers’ pressure increases when the buyers’ momentum became weak at the level of $4087. The price commences a bearish trend in which the former support level of $3927 has turned to a resistance level. The bears gained more pressure and the price declines further facing the support level of $3740. S&P 500 is making an attempt to reach the $3740 level.
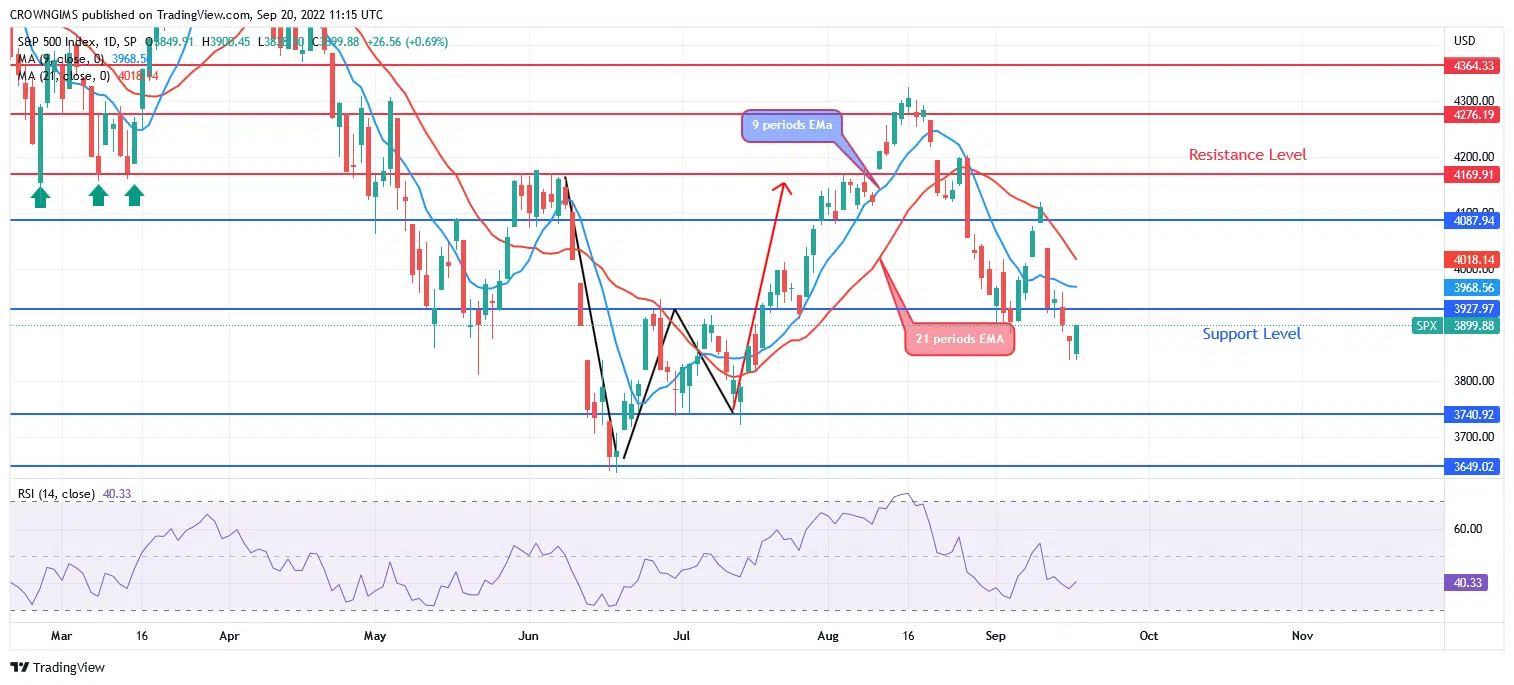
S&P 500 is trading below the 9 periods EMA and the 21 periods EMA at distance which connote an increase in the bears’ pressure. The relative strength index period 14 is at 40 levels with the signal lines pointing up to indicate buy signal which may be a pullback. In case the support level of $3740 is defended by the bulls, price may face resistance levels at $3927, $4087 and $4169.
S&P 500 Medium-term Trend: Bearish
S&P 500 is on the bearish movement on the 4-hour chart outlook. Price made a sharp reverse with the formation of bearish candles when the bulls’ pressure failed at the resistance level of $4087. The price could not break up the mentioned resistance levels. S&P 500 may test support level at $3740 level, and further decrease to $3640 support level.
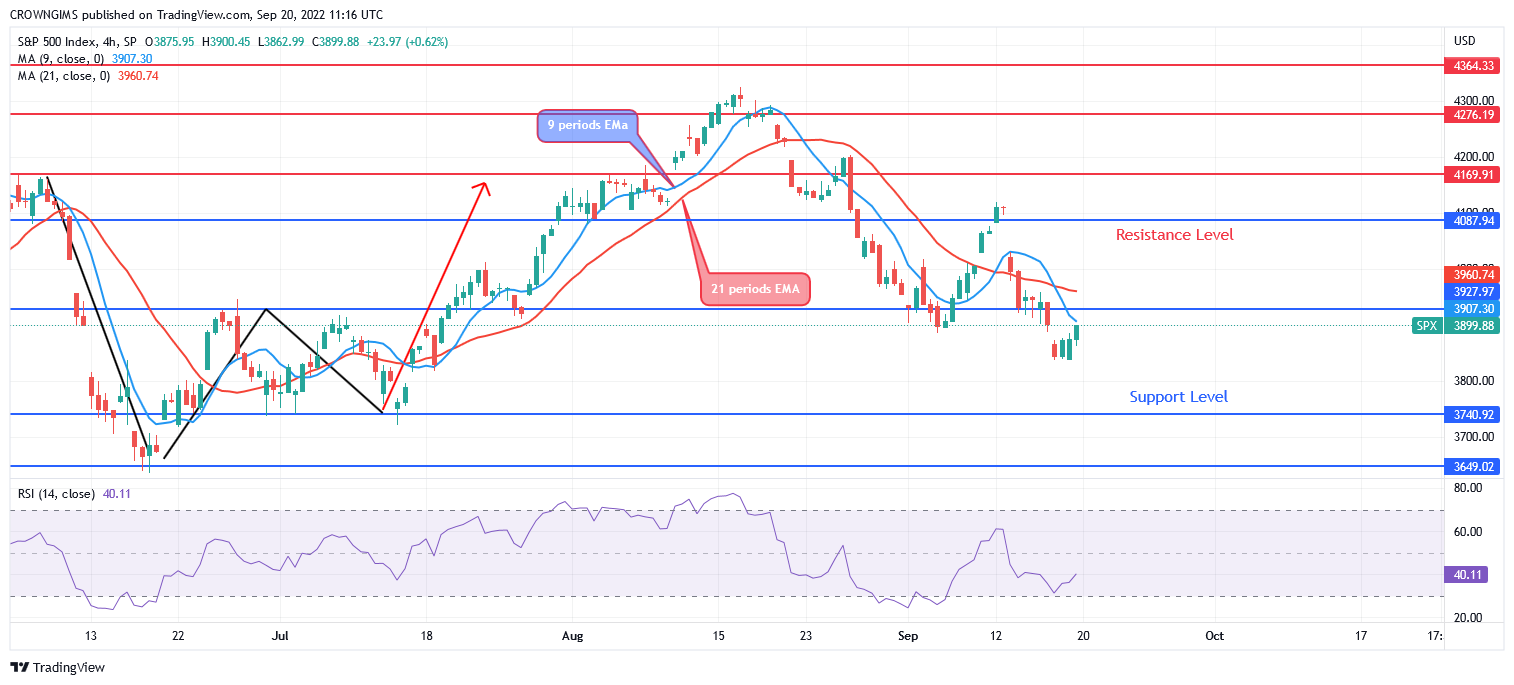
The price is trading below the 9 periods EMA and 21 periods EMA as an indication of bearish movement. The relative strength index period 14 is at 41 levels displaying bullish signal.
You can purchase Lucky Block – Guide, Tips & Insights | Learn 2 Trade here: Buy LBlock
- Broker
- Min Deposit
- Score
- Visit Broker

- Award-winning Cryptocurrency trading platform
- $100 minimum deposit,
- FCA & Cysec regulated

- 20% welcome bonus of upto $10,000
- Minimum deposit $100
- Verify your account before the bonus is credited
- Fund Moneta Markets account with a minimum of $250
- Opt in using the form to claim your 50% deposit bonus
Learn to Trade
Never Miss A Trade Again

Signal Notification
Real-time signal notifications whenever a signal is opened, closes or Updated

Get Alerts
Immediate alerts to your email and mobile phone.

Entry Price Levels
Entry price level for every signal Just choose one of our Top Brokers in the list above to get all this free.