Bullish pressure increases in S&P 500 market
S&P 500 Price Analysis – 29 November
When the momentum of the buyers increases S&P 500 may increase to a resistance level of $4087, and a further increase is envisaged towards the $4169 and $4276 levels. The support levels can be found at $3954, $3740, and $3649.
Key levels:
Resistance levels: $4087, $4169, $4276
Support levels: $3954, $3740, $3649
S&P 500 Long-term trend: Bullish
S&P 500 is bullish on the daily chart. Last week, there was low volatility in the S&P 500. This is what made low significant movement in the S&P 500 market. The resistance level of $3454 was broken upside on 10 November. The price is currently exposed to the resistance level of $4087. The price is gradually increasing. The price may reach the resistance level of $4087 this week.
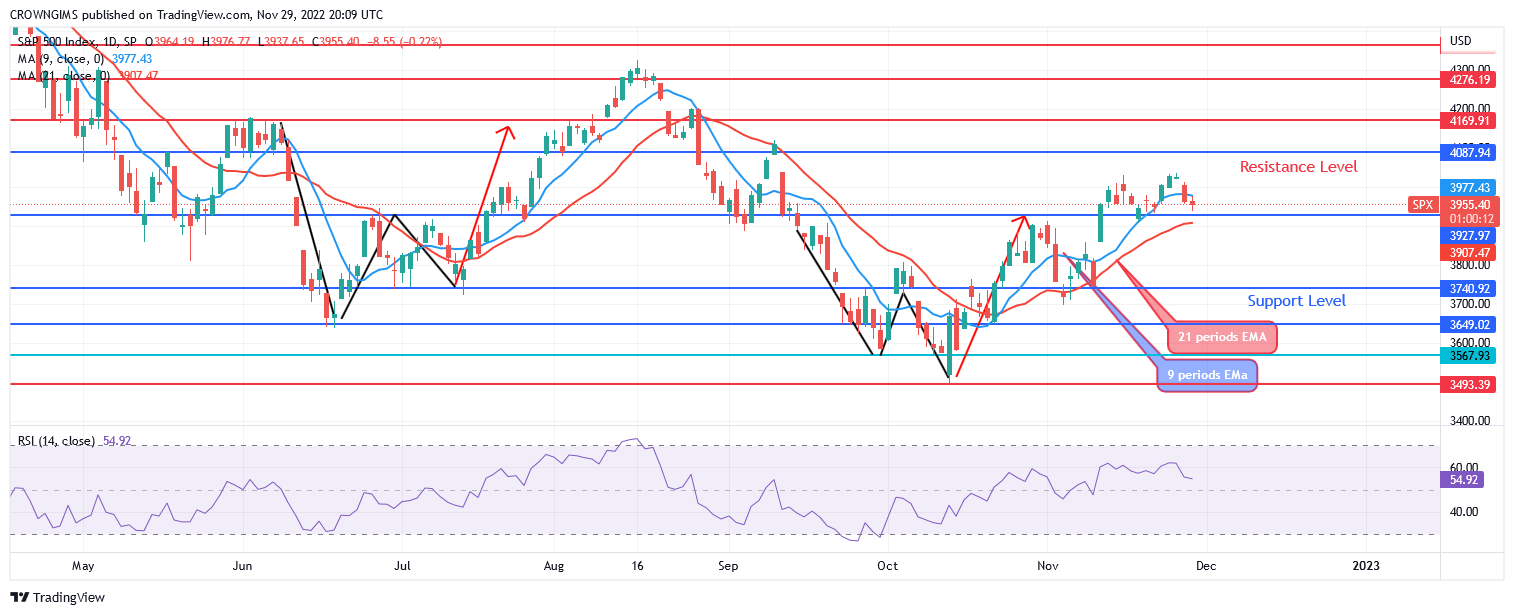
S&P 500 is trading slightly above the 9-periods EMA and the 21-period EMA which indicate a bullish momentum. When the momentum of the buyers increases S&P 500 may increase to a resistance level of $4087, and a further increase is envisaged towards the $4169 and $4276 levels. The support levels can be found at $3954, $3740, and $3649. The relative strength index period 14 is at 54 levels with the signal lines pointing down to indicate a sell signal.
S&P 500 Medium-term Trend: Bullish
S&P 500 is on a bullish movement in the 4-hour chart outlook. The price is soaring north after the formation of the bullish chart pattern called the Double bottom in the 4-hour time frame. The price is currently retesting the support level of $3954 level.
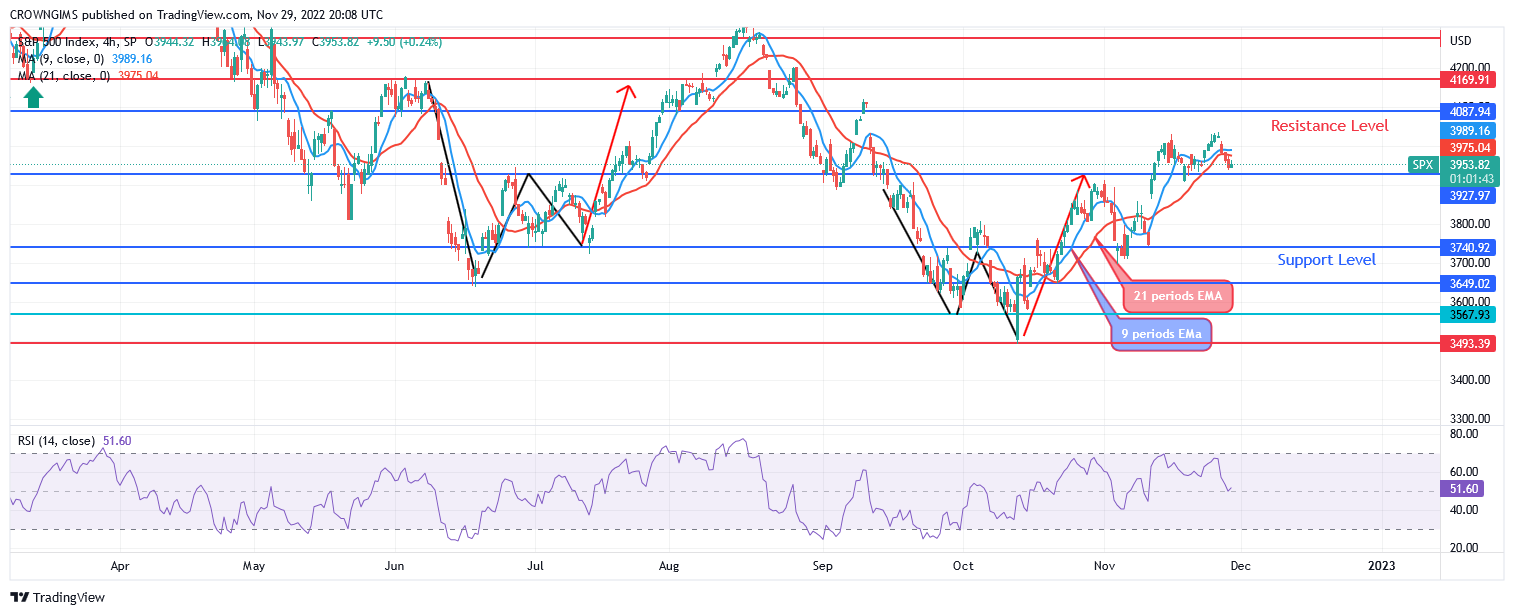
The price is trading above the 9-periods EMA and 21-periods EMA as an indication of bullish movement. The relative strength index period 14 is at 51 levels displaying a bullish signal.
You can purchase Lucky Block – Guide, Tips & Insights | Learn 2 Trade here. Buy LBLOCK
- Broker
- Min Deposit
- Score
- Visit Broker

- Award-winning Cryptocurrency trading platform
- $100 minimum deposit,
- FCA & Cysec regulated

- 20% welcome bonus of upto $10,000
- Minimum deposit $100
- Verify your account before the bonus is credited
- Fund Moneta Markets account with a minimum of $250
- Opt in using the form to claim your 50% deposit bonus
Learn to Trade
Never Miss A Trade Again

Signal Notification
Real-time signal notifications whenever a signal is opened, closes or Updated

Get Alerts
Immediate alerts to your email and mobile phone.

Entry Price Levels
Entry price level for every signal Just choose one of our Top Brokers in the list above to get all this free.