Buyers are dominating S&P 500 market
S&P 500 Price Analysis – 21 March
The S&P 500 might break through the $3927 support level if selling pressure increases, and more selling could push the price down to the $3806 and $3740 levels. If the $3927 support level is maintained, the price may reverse and rise in the direction of the resistance levels of $4087, $4169, and $4276.
Key Levels:
Resistance levels: $4087, $4169, $4276
Support levels: $3927, $3806, $3740
S&P 500 Long-term trend: Bearish
S&P 500 is moving in a bearish direction on the daily chart. $4169 was tested as a resistance level on February 7. The lack of bullish momentum prevented the price from passing through the stated level. As the sellers put more and more pressure on the price, it followed their directives. The price of the commodity began to decline on March 1 and dropped as low as $3927. The price dropped below the dynamic resistance level. The $3927 support level was broken downside by more selling pressure. The price is currently circling about $3927 level.
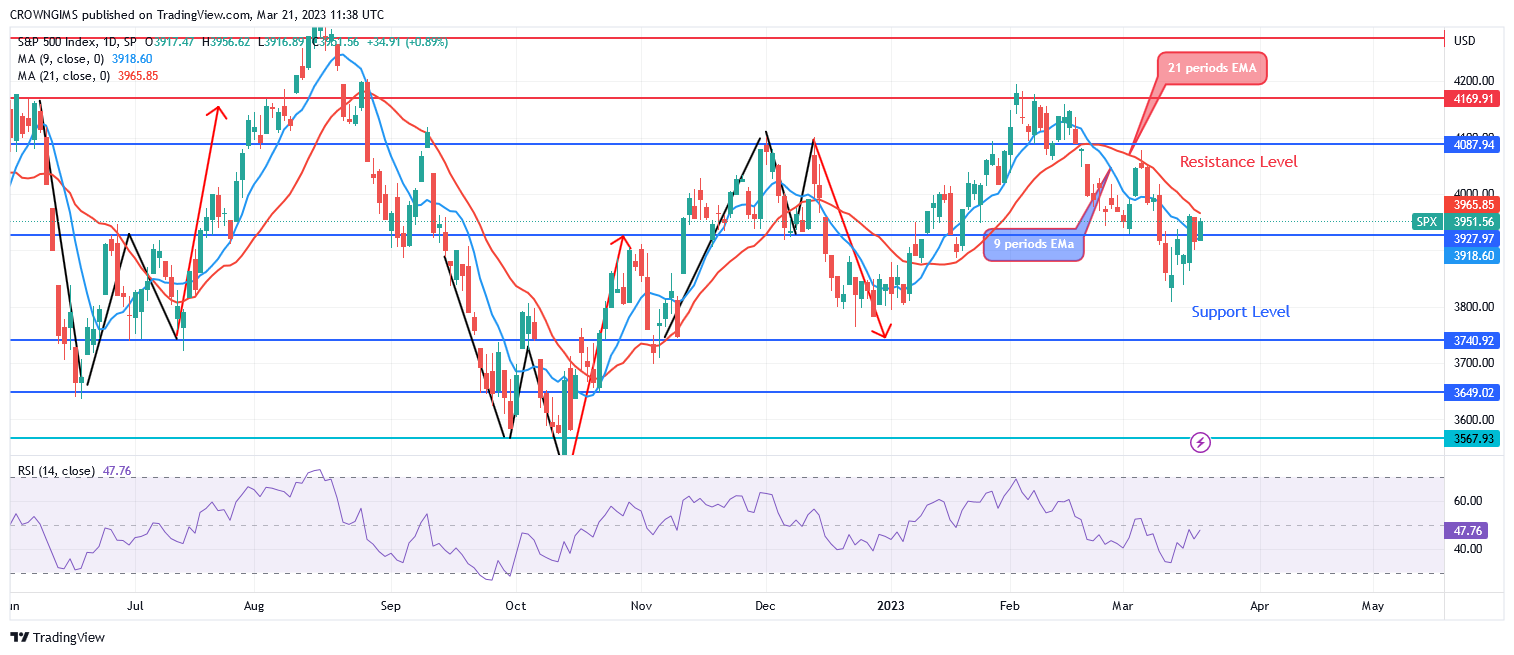
The 9-period EMA is below the 21 periods EMA. The S&P 500 might break through the $3927 support level if selling pressure increases, and more selling could push the price down to the $3806 and $3740 levels. If the $3927 support level is maintained, the price may reverse and rise in the direction of the resistance levels of $4087, $4169, and $4276. The signal line is pointing up and the relative strength index period 14 is at 47, indicating a purchase signal that may be a pullback.
S&P 500 Medium-term Trend: Bullish
On the 4-hour chart, the S&P 500 is in the bullish direction. The $4169 resistance level was held by the sellers, stopping the S&P 500 from rising significantly higher. The selling power pushed the price down as soon as the price reached the $3927 support level. The price was heading toward $3740 level when the $3927 could not hold. Purchasers interrupt sellers and the price is rising at the moment.
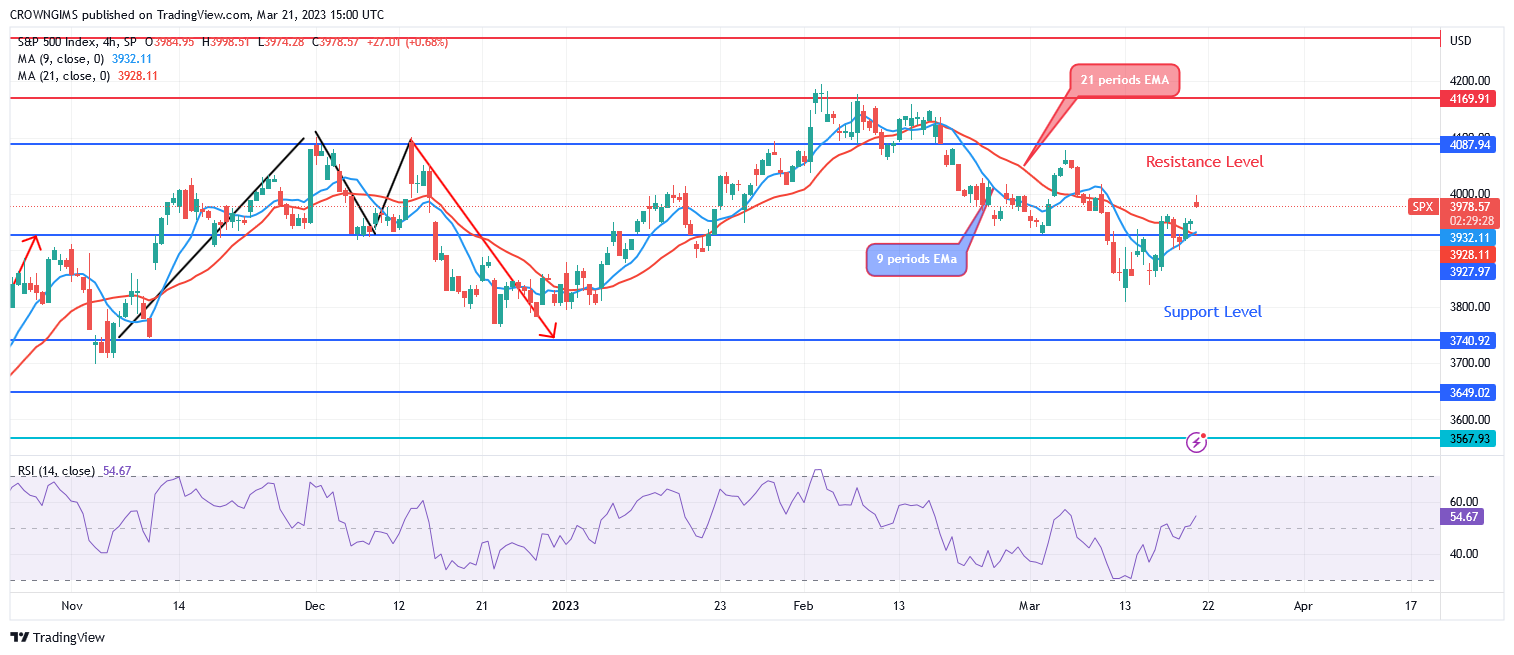
The price of the S&P 500 is trading higher than both the exponential moving averages of 9 and 21 periods. A bullish signal is visible on the Relative Strength Index period 14 at level 55.
You can purchase Lucky Block – Guide, Tips & Insights | Learn 2 Trade here. Buy LBLOCK
- Broker
- Min Deposit
- Score
- Visit Broker

- Award-winning Cryptocurrency trading platform
- $100 minimum deposit,
- FCA & Cysec regulated

- 20% welcome bonus of upto $10,000
- Minimum deposit $100
- Verify your account before the bonus is credited
- Fund Moneta Markets account with a minimum of $250
- Opt in using the form to claim your 50% deposit bonus
Learn to Trade
Never Miss A Trade Again

Signal Notification
Real-time signal notifications whenever a signal is opened, closes or Updated

Get Alerts
Immediate alerts to your email and mobile phone.

Entry Price Levels
Entry price level for every signal Just choose one of our Top Brokers in the list above to get all this free.