Buyers gain more pressure in S&P 500 market
S&P 500 Price Analysis – 07 May
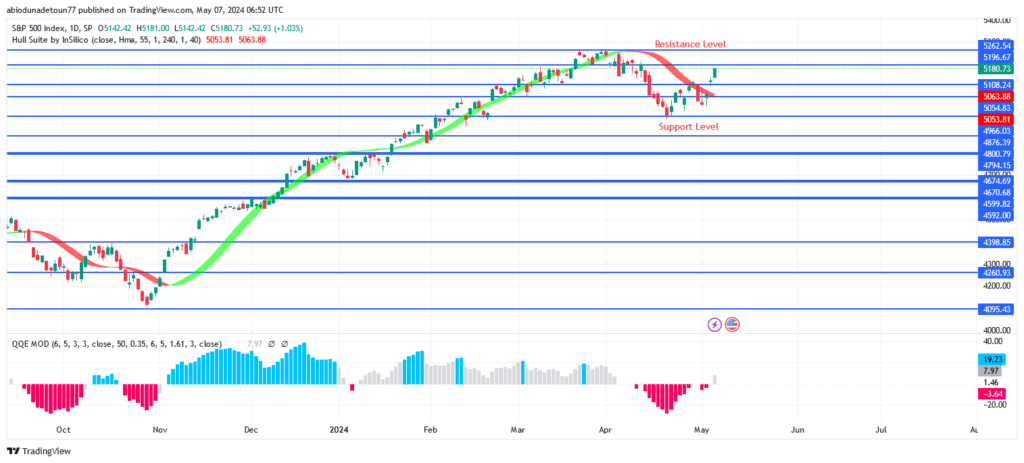
If the $5108 level holds, the S&P 500 can rise and split into the resistance levels of $5199, $5264, and $5344. The price will be exposed to the support levels of $5054 and $4968 if the $5108 support level fails.
Key Levels:
Resistance levels: $5199, $5264, $5344
Support levels: $5108, $5054, $4968
S&P 500 Long-term trend: Bullish
S&P 500 Index is showing an increase on the daily chart. The S&P 500 index has been dominated by purchasers since October of last year. On April 1, the resistance level of $5265 was tested following the breaking of earlier barrier levels. By adhering to the predetermined prices, the sellers are averting additional price increases. The price is declined and tested $4968 level. Buyers gained momentum to defend just mentioned level and the price is currently returning to the previous high.
S&P 500 Medium-term Trend: Bullish
The 4-hour chart of the S&P 500 shows inclining tendencies. Because of the bulls’ tremendous momentum over the past three weeks, the price has been rising over the $5196 resistance level. As the price has risen, the bulls have held fast to the previously established level. The price fell when a bearish engulfing candle occurred last week. The price target of $4968 was met. At the moment, bulls are opposing bears at just mentioned level.
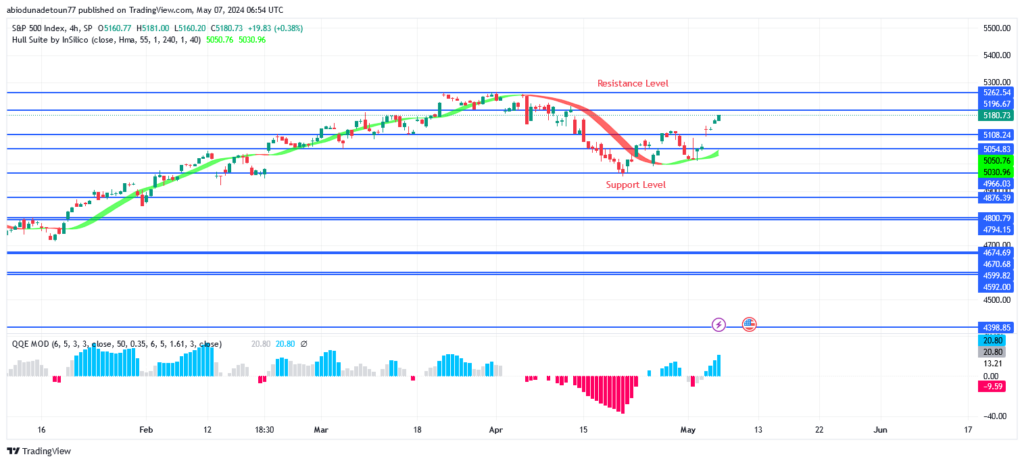
The Hull Suite indicator is less costly than the S&P 500. A buy signal is present when the QQE MOD indicator is more than zero.
You can purchase Lucky Block – Guide, Tips & Insights | Learn 2 Trade here. Buy LBLOCK
- Broker
- Min Deposit
- Score
- Visit Broker

- Award-winning Cryptocurrency trading platform
- $100 minimum deposit,
- FCA & Cysec regulated

- 20% welcome bonus of upto $10,000
- Minimum deposit $100
- Verify your account before the bonus is credited
- Fund Moneta Markets account with a minimum of $250
- Opt in using the form to claim your 50% deposit bonus
Learn to Trade
Never Miss A Trade Again

Signal Notification
Real-time signal notifications whenever a signal is opened, closes or Updated

Get Alerts
Immediate alerts to your email and mobile phone.

Entry Price Levels
Entry price level for every signal Just choose one of our Top Brokers in the list above to get all this free.