S&P 500 Price Analysis – August 16
When bulls’ momentum increase, S&P 500 may penetrate resistance level at $4364 upside, there will be a further increase in price towards $4476 and $4631 levels. Below the price at the moment are support levels at $4276, $4169, and $4087.
Key levels:
Resistance levels: $4364, $4476, $4631
Support levels: $4276, $4169, $4087
S&P 500 Long-term trend: Bullish
S&P 500 is bullish on the daily chart. The bulls are holding unto the S&P 500 market. It has surpass our target at $4169 after the formation of the double bottom chart pattern. This bullish chart pattern triggers the bullish trend in the S&P 500 market. Bulls are gaining more momentum and the price is increasing accordingly. The former resistance level of $4169 and $4276 is broken upside. The price is currently increasing towards the resistance level of $4364.
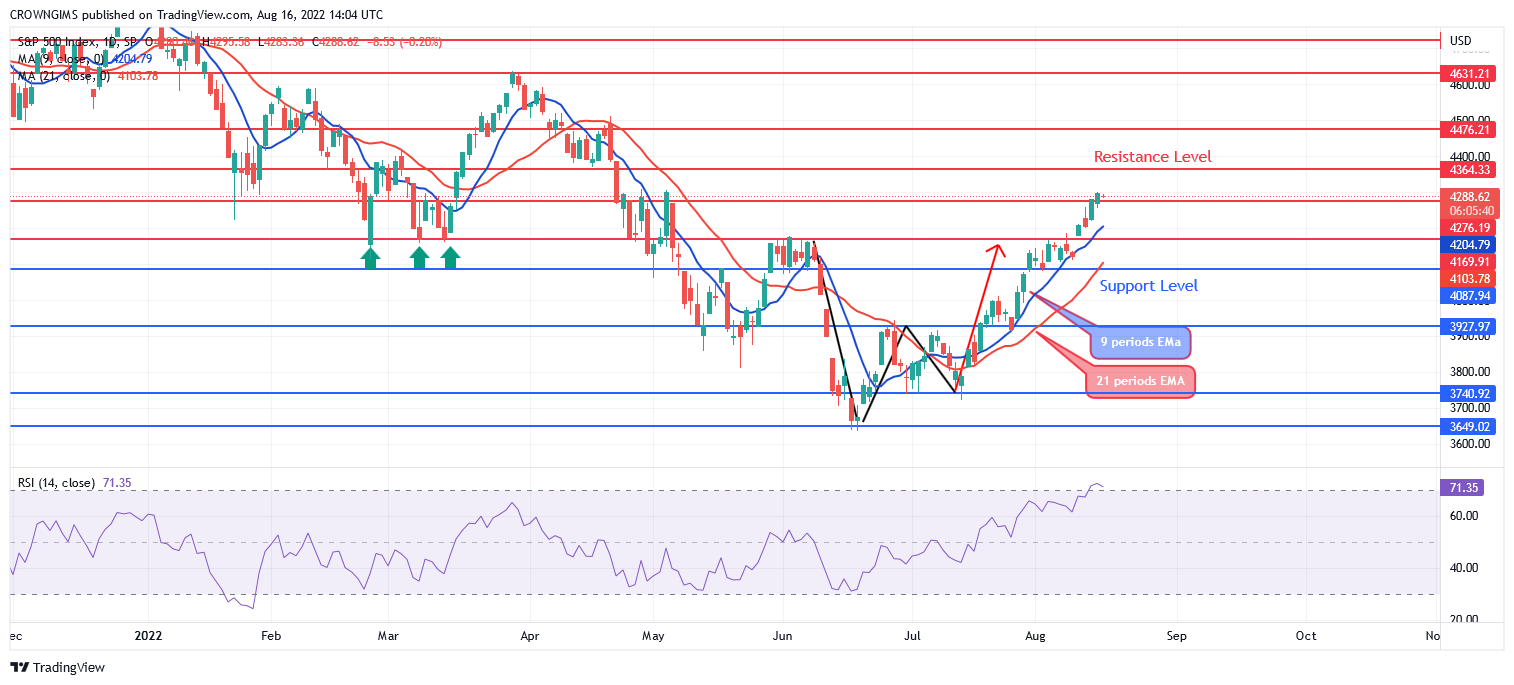
S&P 500 is trading above the 9 periods EMA and the 21 periods EMA which indicate an increase in the buyers’ momentum. When bulls’ momentum increase, S&P 500 may penetrate resistance level at $4364 upside, there will be a further increase in price towards $4476 and $4631 levels. Below the price at the moment are support levels at $4276, $4169, and $4087. However, the relative strength index period 14 is at 71 levels with the signal lines pointing upside to indicate buy signal.
S&P 500 Medium-term Trend: Bullish
S&P 500 is on the bullish movement on the 4-hour chart outlook. The bulls are still dominating the market. When the bulls took over from the bears, the former resistance level of $4169 was broken upside. The bulls steadily follow the direction of the bullish chart pattern; “Double bottom” formed in 4 hour time frame. The price is currently heading towards $4364 level.
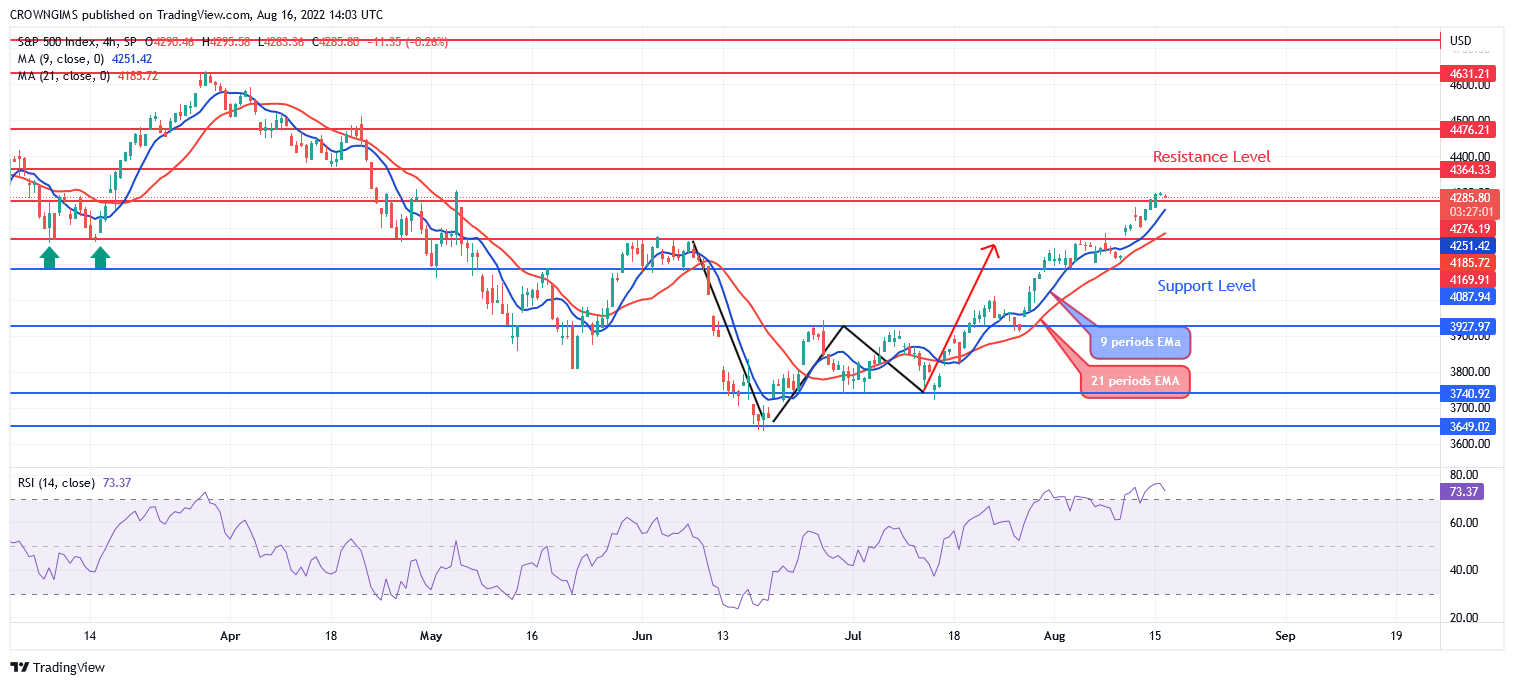
The price is trading above the 9 periods EMA and 21 periods EMA as an indication of bullish movement. The relative strength index period 14 is at 71 levels bending down displaying bearish signal which may be a pullback.
You can purchase Lucky Block – Guide, Tips & Insights | Learn 2 Trade here. Buy LBLOCK
- Broker
- Min Deposit
- Score
- Visit Broker

- Award-winning Cryptocurrency trading platform
- $100 minimum deposit,
- FCA & Cysec regulated

- 20% welcome bonus of upto $10,000
- Minimum deposit $100
- Verify your account before the bonus is credited
- Fund Moneta Markets account with a minimum of $250
- Opt in using the form to claim your 50% deposit bonus
Learn to Trade
Never Miss A Trade Again

Signal Notification
Real-time signal notifications whenever a signal is opened, closes or Updated

Get Alerts
Immediate alerts to your email and mobile phone.

Entry Price Levels
Entry price level for every signal Just choose one of our Top Brokers in the list above to get all this free.