S&P 500 Price Analysis – March 22
An increase in the bulls’ momentum may break up the resistance level of $4476, S&P 500 may incline to $4593 and $4723 levels. In case the resistance level of $4476 holds, price may pullback and face support levels at $4364, $4312 and $4196 levels.
S&P 500 Market
Key levels:
Resistance levels: $4476, $4593, $4723
Support levels: $4364, $4312, $4196
S&P 500 Long-term trend: Bullish
On the daily chart, S&P 500 is bullish. The bears was ruling the market of S&P 500 last two weeks. The price reduced to the support level of $4196. The mentioned support level was tested three times; meaning that triple bottom chart pattern formed. Last week, on 15 March, a bullish engulfing candle formed and the price increases towards the resistance level of $4476 after broken up the $4364 level.
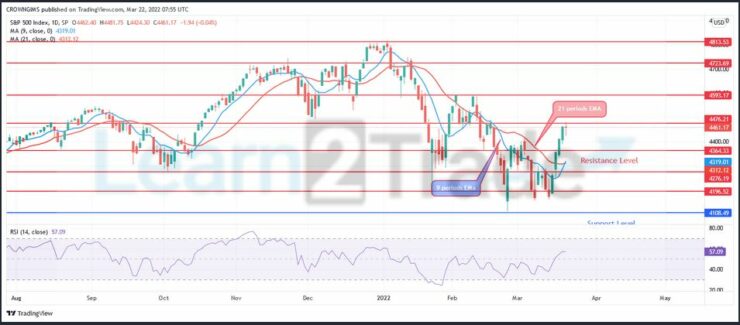
S&P 500 is trading above the 9 periods EMA and the 21 periods EMA which indicate a strong bullish trend in the S&P 500 market. The relative strength index period 14 is at 57 levels with the signal lines pointing up to indicate buy signal. An increase in the bulls’ momentum may break up the resistance level of $4476, S&P 500 may incline to $4593 and $4723 levels. In case the resistance level of $4476 holds, price may pullback and face support levels at $4364, $4312 and $4196 levels.
S&P 500 Medium-term Trend: Bullish
S&P 500 is on the bullish trend on the daily chart outlook. The sellers’ momentum could not break down the support level of $4196 at the second and third testing stage. The bulls exert more pressure and it makes price to experience a bullish reversal movement. The price is under the control of the bulls at the moment. The former resistance level of $4364 has turned to support level.
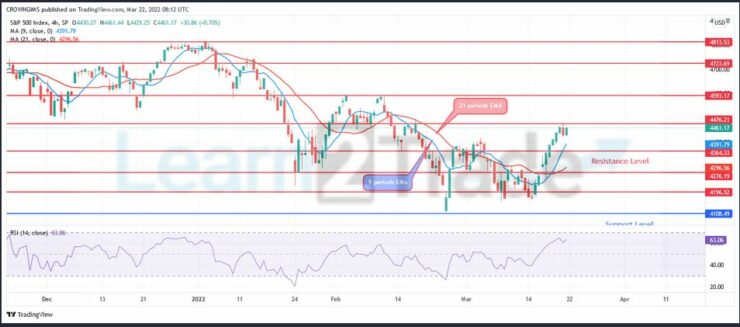
The price is trading above the 9 periods EMA and 21 periods EMA as an indication of bullish movement. The relative strength index period 14 is at 63 levels displaying buy signal.
You can purchase Lucky Block – Guide, Tips & Insights | Learn 2 Trade here. Buy LBlock:
- Broker
- Min Deposit
- Score
- Visit Broker

- Award-winning Cryptocurrency trading platform
- $100 minimum deposit,
- FCA & Cysec regulated

- 20% welcome bonus of upto $10,000
- Minimum deposit $100
- Verify your account before the bonus is credited
- Fund Moneta Markets account with a minimum of $250
- Opt in using the form to claim your 50% deposit bonus
Learn to Trade
Never Miss A Trade Again

Signal Notification
Real-time signal notifications whenever a signal is opened, closes or Updated

Get Alerts
Immediate alerts to your email and mobile phone.

Entry Price Levels
Entry price level for every signal Just choose one of our Top Brokers in the list above to get all this free.