S&P 500 Price Analysis – July 12
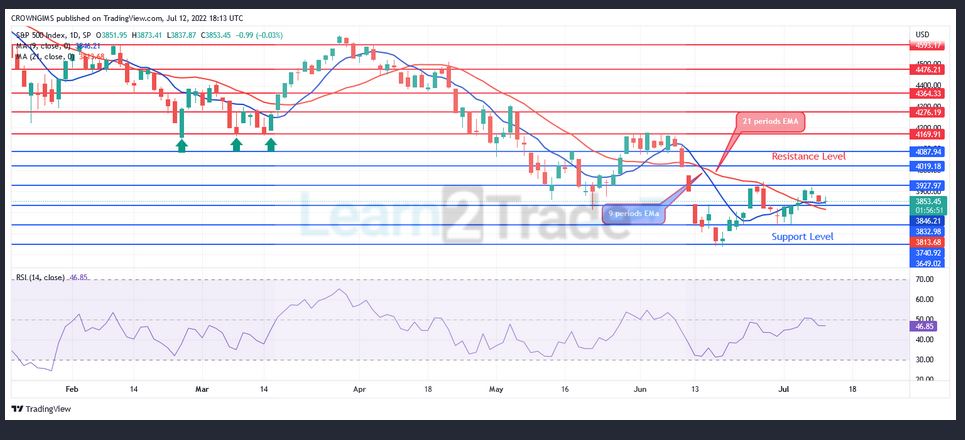
In case the bulls’ pressure could break up resistance level of $3927, price may increase towards resistance levels at $4019, and $4087. S&P 500 may penetrate resistance level at $3827 upside, and further increase envisaged.
Key levels:
Resistance levels: $3927, $4019, $4087
Support levels: $3832, $3740, $3649
S&P 500 Long-term trend: Bullish
S&P 500 is bullish on the daily chart. The bears eventually push the price to the support level at $3740 on June 16. It bounced up from the mentioned support level and penetrates the dynamic resistance level. The resistance level of $3927 is tested few days ago. Today, the price is pulling back towards the $3832 level.
S&P 500 Medium-term Trend: Bullish
On the 4-hour chart outlook, S&P 500 is on the bullish movement. The support level of $3649 has been tested and bears could not penetrate the level downside. The bulls reacted against the bearish movement and the price breaks up $3832 level. Price bounced towards $3927 level after it breaks up $3740 and $3832 levels. S&P 500 may penetrate resistance level at $3827 upside, and further increase envisaged.
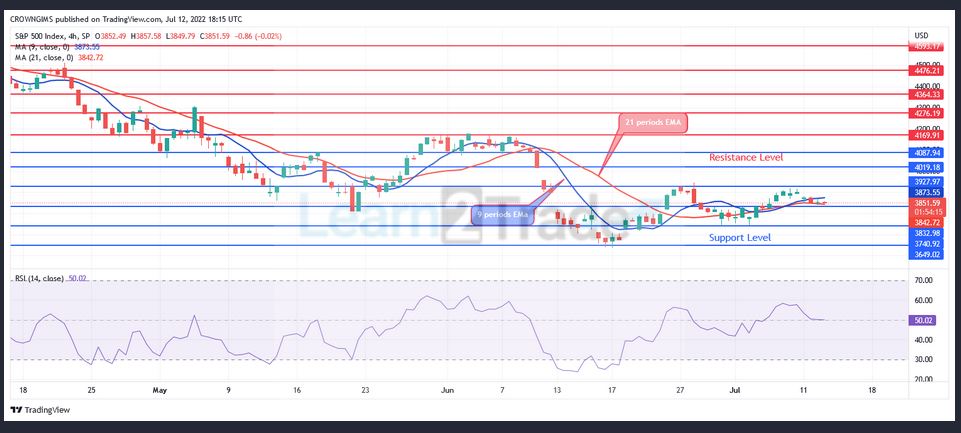
The price is trading above the 9 periods EMA and 21 periods EMA as an indication of bullish movement. The relative strength index period 14 is at 49 levels displaying bearish signal which may be a pullback.
You can purchase Lucky Block – Guide, Tips & Insights | Learn 2 Trade here: Buy LBlock
- Broker
- Min Deposit
- Score
- Visit Broker

- Award-winning Cryptocurrency trading platform
- $100 minimum deposit,
- FCA & Cysec regulated

- 20% welcome bonus of upto $10,000
- Minimum deposit $100
- Verify your account before the bonus is credited
- Fund Moneta Markets account with a minimum of $250
- Opt in using the form to claim your 50% deposit bonus
Learn to Trade
Never Miss A Trade Again

Signal Notification
Real-time signal notifications whenever a signal is opened, closes or Updated

Get Alerts
Immediate alerts to your email and mobile phone.

Entry Price Levels
Entry price level for every signal Just choose one of our Top Brokers in the list above to get all this free.