An increase in Sellers’ pressure may decrease price to the $4364 level
S&P 500 Price Analysis – 08 August
If the $4631 level is maintained, the price may reverse and fall in the direction of the support levels of $4476, $4364, and $4276. In case the $4631 level is broken, the price may surpass the $4723 resistance level and continue to rise as high as $4813
Key Levels:
Resistance levels: $4631, $4723, $4813
Support levels: $4476, $4364, $4276
S&P 500 Long-term trend: Bearish
On the daily chart, the S&P 500 is moving in the bearish direction. When there was little to no selling pressure in the S&P market, price was unable to hit the $3740 support level. Bullish pressure rises started on March 16 and peaked at $4631. It seems the bulls were exhausted and could not push the price above the just-mentioned level. Bears gathered more pressure and the price is currently pulling back to retest $4476 support level.
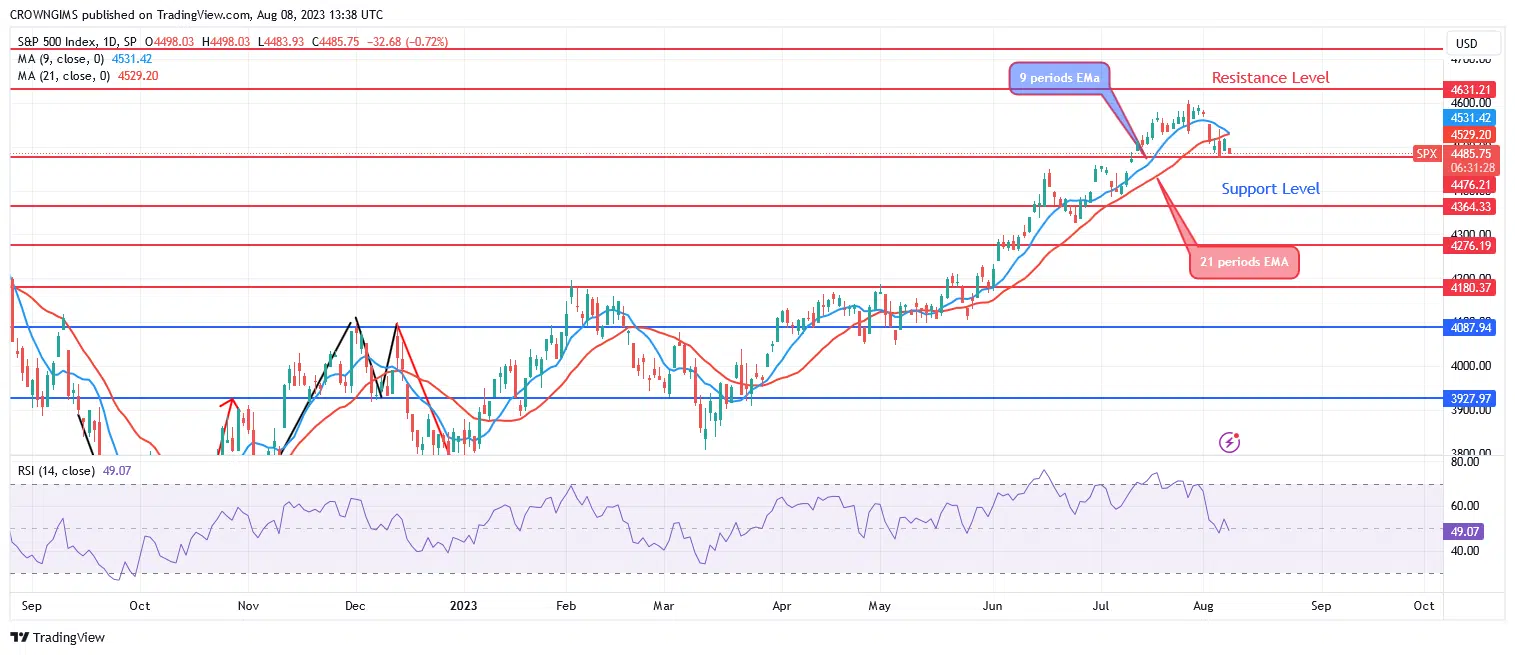
If the $4631 level is maintained, the price may reverse and fall in the direction of the support levels of $4476, $4364, and $4276. A sell signal is shown by the relative strength index period 14 being at 46 and the signal line pointing downward. If the $4631 level is broken, the price may surpass the $4723 resistance level and continue to rise as high as $4813.
S&P 500 Medium-term Trend: Bearish
On the 4-hour chart, the S&P 500 is trending downward. By holding the $4631 barrier level, the sellers were able to stop the price of the S&P 500 from rising much. The price started to fall as soon as it bounced off the $4631 barrier level as consumer demand increased. The psychological ceiling of $4476 was in sight as the price decreased. When the selling pressure grew, the $4476 threshold level may be crossed. The current objective level is $4364.
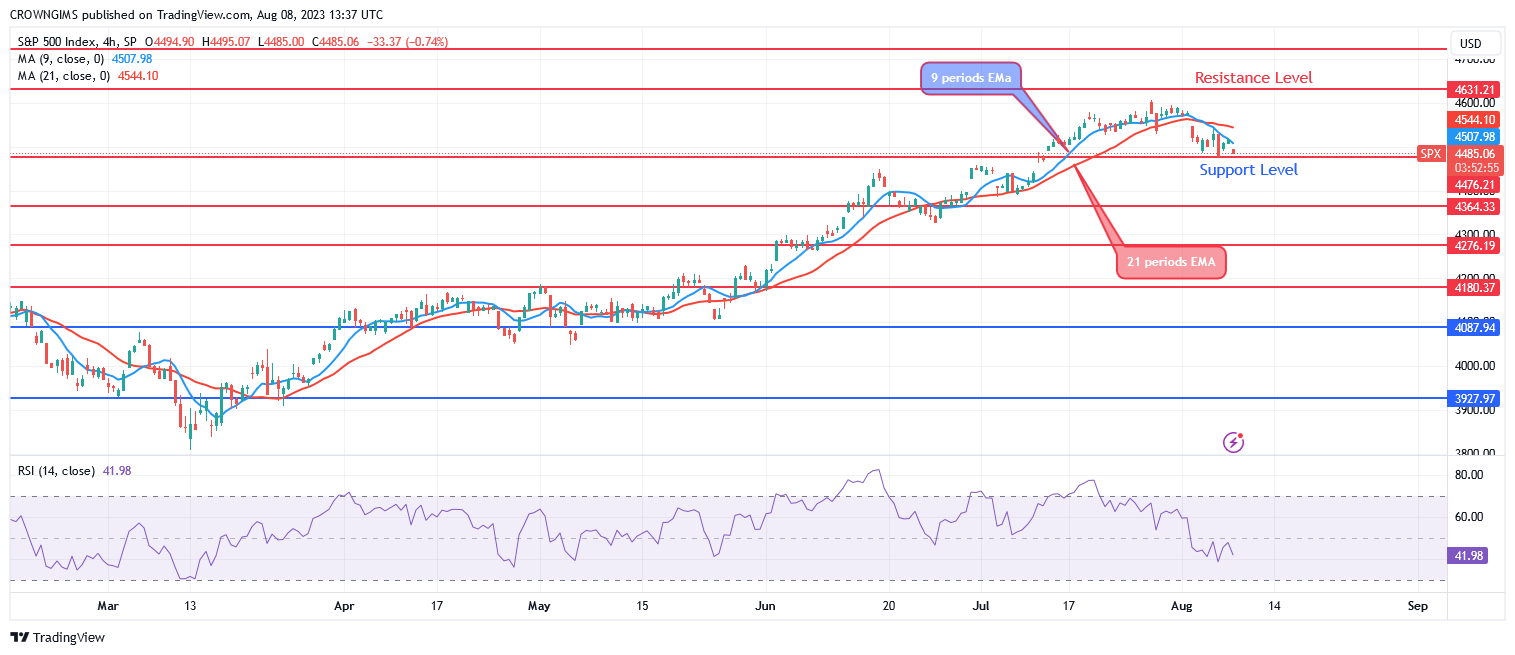
The S&P 500 price is currently lower below both the 9- and 21-period exponential moving averages. The Relative Strength Index period 14 at level 39 displays a bearish signal.
You can purchase Lucky Block – Guide, Tips & Insights | Learn 2 Trade here. Buy LBLOCK
- Broker
- Min Deposit
- Score
- Visit Broker

- Award-winning Cryptocurrency trading platform
- $100 minimum deposit,
- FCA & Cysec regulated

- 20% welcome bonus of upto $10,000
- Minimum deposit $100
- Verify your account before the bonus is credited
- Fund Moneta Markets account with a minimum of $250
- Opt in using the form to claim your 50% deposit bonus
Learn to Trade
Never Miss A Trade Again

Signal Notification
Real-time signal notifications whenever a signal is opened, closes or Updated

Get Alerts
Immediate alerts to your email and mobile phone.

Entry Price Levels
Entry price level for every signal Just choose one of our Top Brokers in the list above to get all this free.