Bullish pressure decreases in S&P 500 market
S&P 500 Price Analysis – 06 December
S&P 500 may break down the support level of $3987, and further decrease envisaged towards $3740 and $3649 levels. The resistance level of $4087 can be penetrated if buyers increase their pressure, then, the resistance levels of $4169, and $4276 may be tested.
Key levels:
Resistance levels: $4087, $4169, $4276
Support levels: $3937, $3740, $3649
S&P 500 Long-term trend: Bullish
S&P 500 is bullish on the daily chart. There was a low volatility in the S&P 500 last week. S&P 500 trades within the resistance level of $4087 and support level of $3987. The bulls tried to break up the resistance level of $4087 but the bears opposed it. In the same way, the bears made an attempt to break down the support level of $3937 but the bulls defended the mentioned level. It pulls back and it is currently testing the support level of $3937.
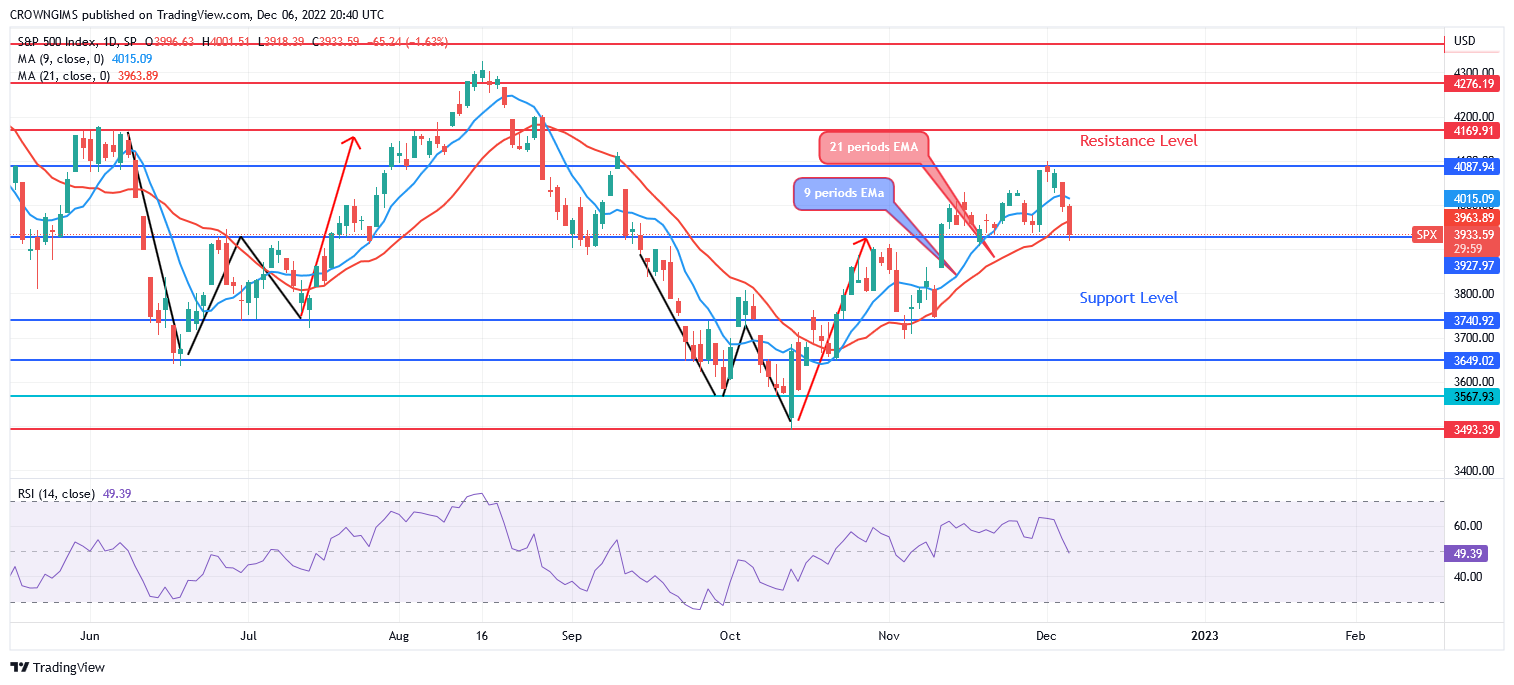
S&P 500 is trading slightly below the 9-periods EMA and the 21-period EMA, indicating a bearish momentum. When the momentum of the sellers increases, S&P 500 may break down the support level of $3987, and further decrease envisaged towards $3740 and $3649 levels. The resistance level of $4087 can be penetrated if buyers increase their pressure, then, the resistance levels of $4169, and $4276 may be tested. The relative strength index period 14 is at 49 levels with the signal lines pointing down to indicate a sell signal.
S&P 500 Medium-term Trend: Bearish
S&P 500 is on a bearish movement in the 4-hour chart outlook. It is under the full control of the bulls. The price broke up resistance levels such as $3740 and $3937. It tested the resistance level of $4087. Today, the price pulled back to retest the support level of $3937.
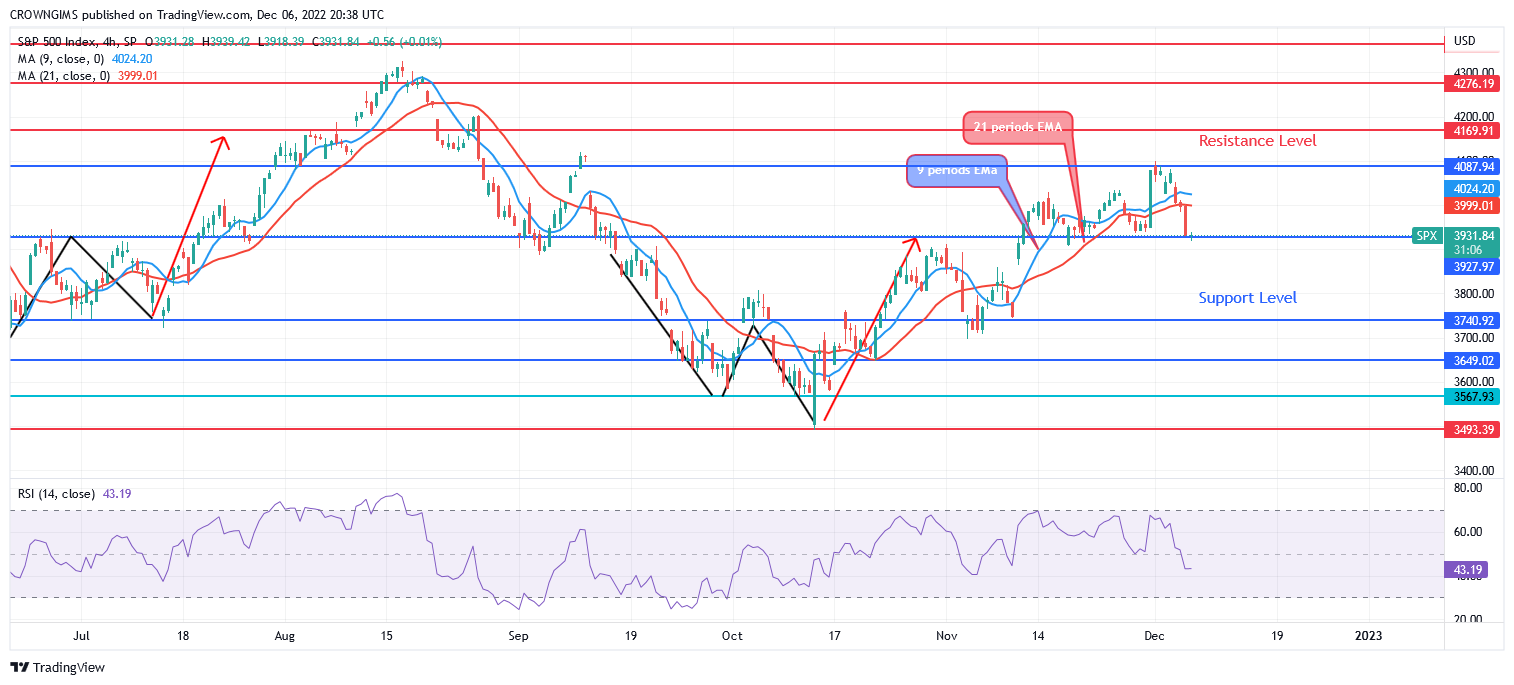
The price is trading below the 9-periods EMA and 21-periods EMA as an indication of bearish movement. The relative strength index period 14 is at 44 levels displaying bearish signal.
You can purchase Lucky Block – Guide, Tips & Insights | Learn 2 Trade here. Buy LBLOCK
- Broker
- Min Deposit
- Score
- Visit Broker

- Award-winning Cryptocurrency trading platform
- $100 minimum deposit,
- FCA & Cysec regulated

- 20% welcome bonus of upto $10,000
- Minimum deposit $100
- Verify your account before the bonus is credited
- Fund Moneta Markets account with a minimum of $250
- Opt in using the form to claim your 50% deposit bonus
Learn to Trade
Never Miss A Trade Again

Signal Notification
Real-time signal notifications whenever a signal is opened, closes or Updated

Get Alerts
Immediate alerts to your email and mobile phone.

Entry Price Levels
Entry price level for every signal Just choose one of our Top Brokers in the list above to get all this free.