S&P 500 Price Analysis – March 15
Further increase in the bears’ momentum may push down the price below the support level of $4108, S&P 500 will decline to $4019 and $3927 levels. In case the support level of $4108 holds, price may pullback and face resistance levels at $4196, and $4275 and $4364 levels.
S&P 500 Market
Key levels:
Resistance levels: $4196, $4275, $4364
Support levels: $4108, $4019, $3927
S&P 500 Long-term trend: Bearish
On the weekly chart, S&P 500 is bearish. S&P 500 still remains under the control of the bears. the bulls are pulling the price back as a sign of retracement in a trending market. On February 24, the price declined and found support at $4108 level. The bulls pushed it back to retest the resistance level of $4364. The confluence at the level prevented further price increase. The bears increase their pressure and price continues its bearish trend.
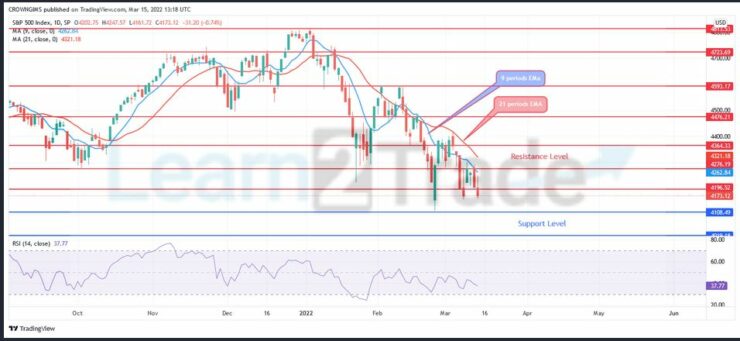
S&P 500 is trading below the 9 periods EMA and the 21 periods EMA which indicate a strong bearish trend in the S&P 500 market. The relative strength index period 14 is at 39 levels with the signal lines pointing down to indicate sell signal. Further increase in the bears’ momentum may push down the price below the support level of $4108, S&P 500 will decline to $4019 and $3927 levels. In case the support level of $4108 holds, price may pullback and face resistance levels at $4196, and $4275 and $4364 levels.
S&P 500 Medium-term Trend: Bearish
S&P 500 is on the bearish trend on the daily chart outlook. The sellers exert more pressure and it makes bearish movement continue in the market. The price is still under the control of the double top chart pattern formed at the resistance level of $4393. The former support level of $4196 and $4276 has turned to resistance level.
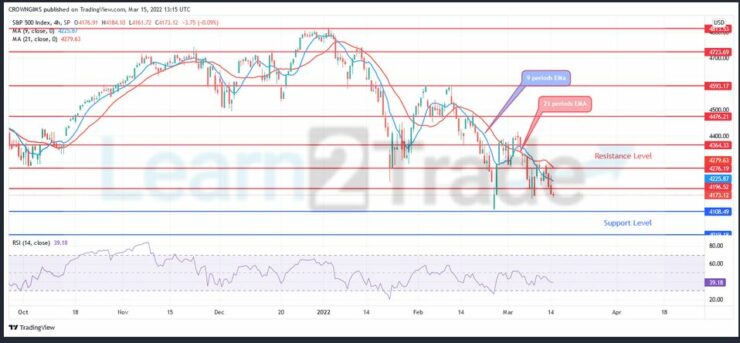
The price is trading below the 9 periods EMA and 21 periods EMA as an indication of bearish movement. The relative strength index period 14 is at 37 levels displaying sell signal.
You can purchase Lucky Block – Guide, Tips & Insights | Learn 2 Trade here. Buy LBlock:
- Broker
- Min Deposit
- Score
- Visit Broker

- Award-winning Cryptocurrency trading platform
- $100 minimum deposit,
- FCA & Cysec regulated

- 20% welcome bonus of upto $10,000
- Minimum deposit $100
- Verify your account before the bonus is credited
- Fund Moneta Markets account with a minimum of $250
- Opt in using the form to claim your 50% deposit bonus
Learn to Trade
Never Miss A Trade Again

Signal Notification
Real-time signal notifications whenever a signal is opened, closes or Updated

Get Alerts
Immediate alerts to your email and mobile phone.

Entry Price Levels
Entry price level for every signal Just choose one of our Top Brokers in the list above to get all this free.