S&P 500 Price Analysis – February 22
In case the bears push the price to penetrate the support level of $4307, S&P 500 will decline to $4248 and $4169 levels. In case the bulls gain more pressure and defend $4307 support level, then, the resistance level of $4405 may be broken upside and it may increase to $4452 and $4524 resistance levels.
S&P 500 Market
Key levels:
Resistance levels: $4405, $4452, $4524
Support levels: $4307, $4248, $4169
S&P 500 Long-term trend: Bearish
S&P 500 is bearish on the weekly chart. The price action on weekly chart formed “M” chart pattern at $4768 resistance level; this is what triggered a bearish trend on the weekly chart. The price continue to obey the chart pattern. Last two weeks, the price pulled back to retest $4524 level. After the pullback, the sellers increased their pressure and it broke down the support levels at $4472 and $4405. The price is currently targeting the support level of $4307.
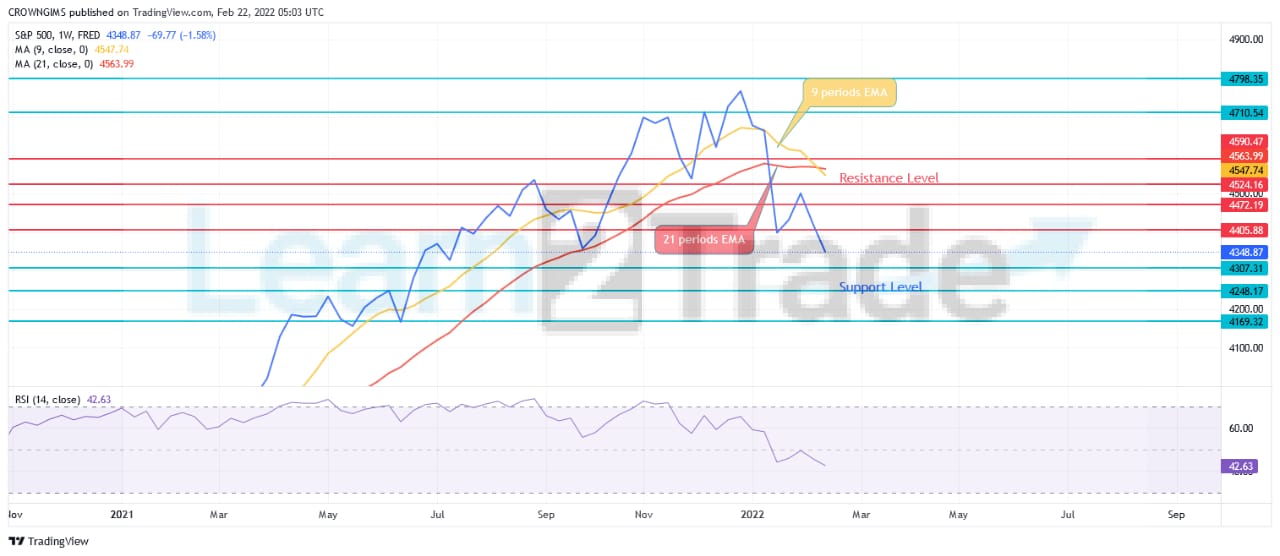
S&P 500 is trading below the 9 periods EMA and the 21 periods EMA at distance which indicate strong bearish pressure in the S&P 500 market. The relative strength index period 14 is at 42 levels with the signal lines pointing down to indicate sell signal. In case the bears push the price to penetrate the support level of $4307, S&P 500 will decline to $4248 and $4169 levels. In case the bulls gain more pressure and defend $4307 support level, then, the resistance level of $4405 may be broken upside and it may increase to $4452 and $4524 resistance levels.
S&P 500 Medium-term Trend: Bearish
S&P 500 is on the bearish movement on the daily chart outlook. The double top chart pattern formed at the resistance level of $4524 indicate that bears are dominating market. The price declines, former support levels of $4452 and $4405 have turned to resistance levels. The price is heading towards $4307.
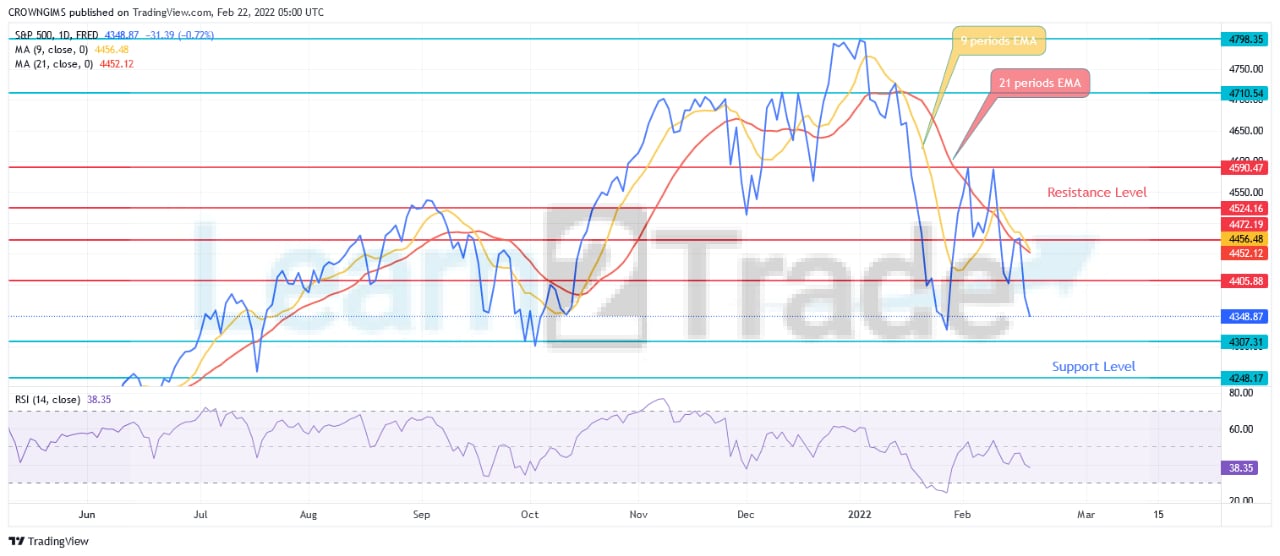
The price is trading below the 9 periods EMA and 21 periods EMA as an indication of bearish movement. The relative strength index period 14 is at 38 levels displaying sell signal.
You can purchase Lucky Block – Guide, Tips & Insights | Learn 2 Trade here. Buy LBlock:
- Broker
- Min Deposit
- Score
- Visit Broker

- Award-winning Cryptocurrency trading platform
- $100 minimum deposit,
- FCA & Cysec regulated

- 20% welcome bonus of upto $10,000
- Minimum deposit $100
- Verify your account before the bonus is credited
- Fund Moneta Markets account with a minimum of $250
- Opt in using the form to claim your 50% deposit bonus
Learn to Trade
Never Miss A Trade Again

Signal Notification
Real-time signal notifications whenever a signal is opened, closes or Updated

Get Alerts
Immediate alerts to your email and mobile phone.

Entry Price Levels
Entry price level for every signal Just choose one of our Top Brokers in the list above to get all this free.