Sellers’ pressure is increasing in S&P 500 market
S&P 500 Price Analysis – 30 April
The S&P 500 may increase and break up into the resistance levels of $5108, $5196, and $5265, if the $5056 level holds. In the case that the $5056 support level breaks, the price will be exposed to the support levels of $4968 and 44876.
Key Levels:
Resistance levels: $5108, $5196, $5265
Support levels: $5056, $4968, $4876
S&P 500 Long-term trend: Bearish
The daily chart indicates a decline in the S&P 500 Index. Since October of last year, buyers have controlled the S&P 500 index. After previous barrier levels broke, the resistance level of $5265 was tested on April 1. The vendors are preventing further price hikes by sticking to the agreed-upon pricing. Strong bearish daily candles have been seen, and the price is currently dropping below $5108.
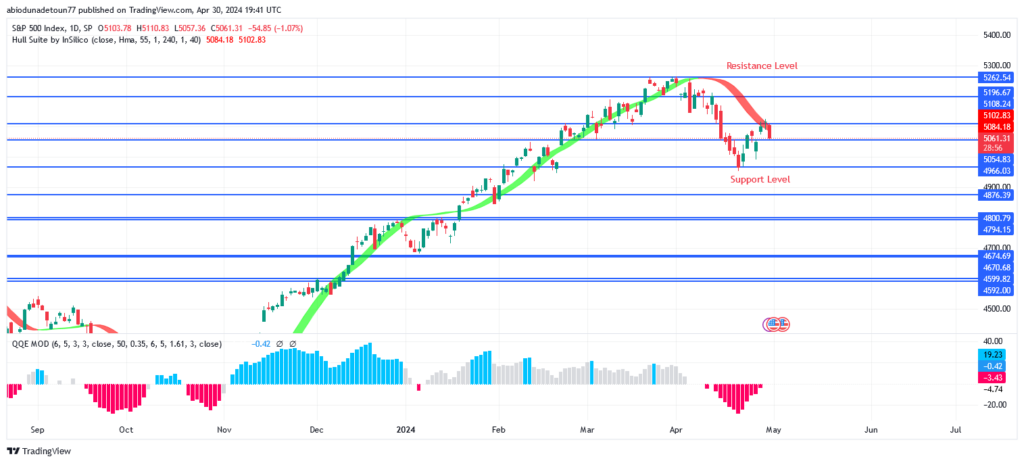
The S&P 500 may increase and break up into the resistance levels of $5108, $5196, and $5265, if the $5056 level holds. In the case that the $5056 support level breaks, the price will be exposed to the support levels of $4968 and 44876. The QQE MOD histogram and the Hull Suite forex signals both indicate a sell. It may continue on its downward trajectory.
S&P 500 Medium-term Trend: Bearish
The S&P 500’s 4-hour chart demonstrates downward trends. The price has been increasing over the $5196 resistance level over the last few weeks as a result of the bulls’ strong momentum. The bulls have clung to the previously set level as the price has increased. Last week, a bearish engulfing candle appeared, and the price dropped. It seems likely that the $4968 price objective will be reached.
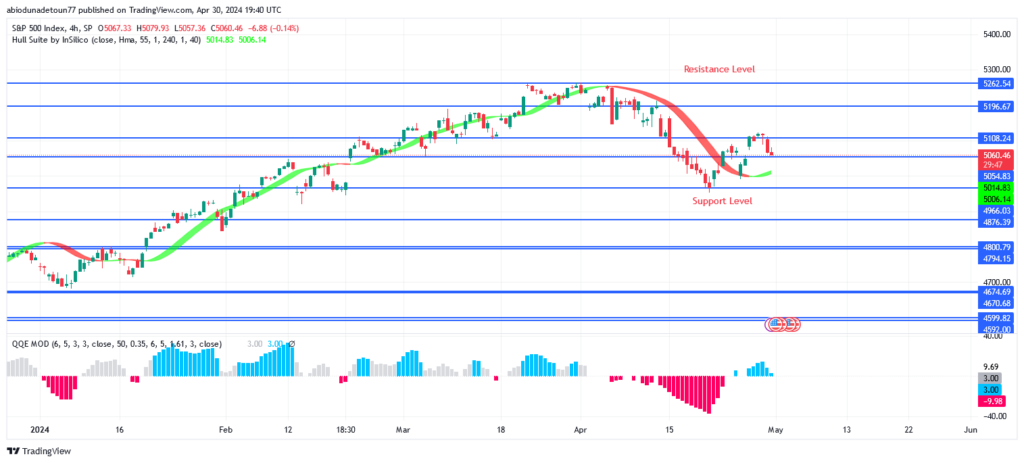
Compared to the S&P 500, the Hull Suite indication is more expensive. When the QQE MOD indicator is less than zero, there is a sell signal.
You can purchase Lucky Block – Guide, Tips & Insights | Learn 2 Trade here. Buy LBLOCK
- Broker
- Min Deposit
- Score
- Visit Broker

- Award-winning Cryptocurrency trading platform
- $100 minimum deposit,
- FCA & Cysec regulated

- 20% welcome bonus of upto $10,000
- Minimum deposit $100
- Verify your account before the bonus is credited
- Fund Moneta Markets account with a minimum of $250
- Opt in using the form to claim your 50% deposit bonus
Learn to Trade
Never Miss A Trade Again

Signal Notification
Real-time signal notifications whenever a signal is opened, closes or Updated

Get Alerts
Immediate alerts to your email and mobile phone.

Entry Price Levels
Entry price level for every signal Just choose one of our Top Brokers in the list above to get all this free.