S&P 500 Price Analysis – December 1
S&P 500 opened near 3662 levels, and it’s up at almost 0.50% intraday, during the initial hour of American open on Tuesday. The index has recovered upside traction after the prior day’s range trading and closes at the 3661 levels. The latest rally suggests the stimulus optimism may be among the market movers.
Key Levels
Resistance Levels: 3750, 3700, 374
Support Levels: 3638, 3595, 3477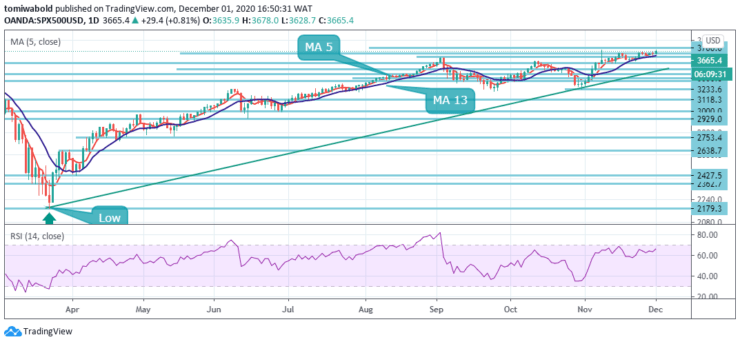
The S&P 500 is set to challenge its 2020 all-time high at 3674 level, which is a key resistance to watch out for from a technical perspective. A significant break above the 3674 resistance level could push it to open the door for a further advance towards the next significant resistance at 3700.
On the other hand, momentum indicators may soon indicate the risk of a potential technical pullback in the overbought zone. The immediate support levels on the daily charts can be found at 3638, followed by 3595.6 and then 3550 thereafter.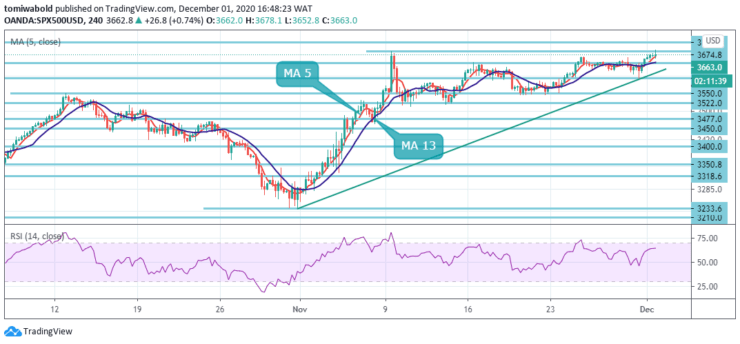
The S&P 500 aims to break the November 9 high at 3674 after prices rallied above the 3658 medium-term resistance zone. While the S&P 500 rallied above 3600, confirmation of a break seems to be lacking.
Moreover, a dip below the resistance zone at 3674 will expose the 3600/3595 floor, opening the door for further consolidation shortly. The ascending trend line stays unchanged, although some short-term pullback is possible. The nearest support level can be found at 3595 further.
Note: Learn2.Trade is not a financial advisor. Do your research before investing your funds in any financial asset or presented product or event. We are not responsible for your investing results
- Broker
- Min Deposit
- Score
- Visit Broker

- Award-winning Cryptocurrency trading platform
- $100 minimum deposit,
- FCA & Cysec regulated

- 20% welcome bonus of upto $10,000
- Minimum deposit $100
- Verify your account before the bonus is credited
- Fund Moneta Markets account with a minimum of $250
- Opt in using the form to claim your 50% deposit bonus
Learn to Trade
Never Miss A Trade Again

Signal Notification
Real-time signal notifications whenever a signal is opened, closes or Updated

Get Alerts
Immediate alerts to your email and mobile phone.

Entry Price Levels
Entry price level for every signal Just choose one of our Top Brokers in the list above to get all this free.