Buyers pressure increase in S&P 500 market
S&P 500 Price Analysis – 07 November
S&P 500 may increase further toward the resistance levels of $4586, $4677, and $4740 if the $4330 level is held. The price can increase to the barrier level of $4740.
Key Levels:
Resistance levels: $4586, $4677, $4740
Support levels: $4330, $4157, $3909
S&P 500 Long-term trend: Bullish
The S&P 500 is trending upward. Since September 1st, sellers have been in charge of the S&P market’s pricing. A bearish reversal was signaled by the “M” chart pattern as the $4586 resistance level. On October 3, the selling pressure caused a test of $4157. When $4330, the support threshold, was crossed. Buyers defending the $4157 support level caused a price increase to break up $4330 level. The market is presently being controlled by the buyers; they are driving the price towards $4586 level.
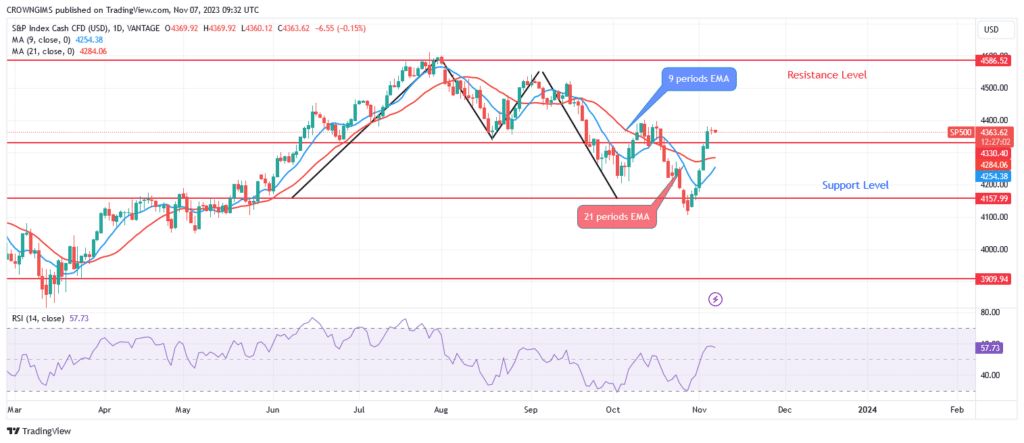
S&P 500 may increase further toward the resistance levels of $4586, $4677, and $4740 if the $4330 level is held. The period 14 relative strength index’s 34 rating and the signal line’s inclining trend both point to buying. The price can increase to the barrier level of $4740.
S&P 500 Medium-term Trend: Bullish
The four-hour chart of the S&P 500 exhibits bullish patterns. Price dropped below the $4157 support level as a result of the double top formation that appeared on the chart near the $4586 resistance level. Bulls held the just-mentioned level and there is a price increase. Last week, a bullish engulfing candle made an appearance, and the price is now targeting $4586 level.
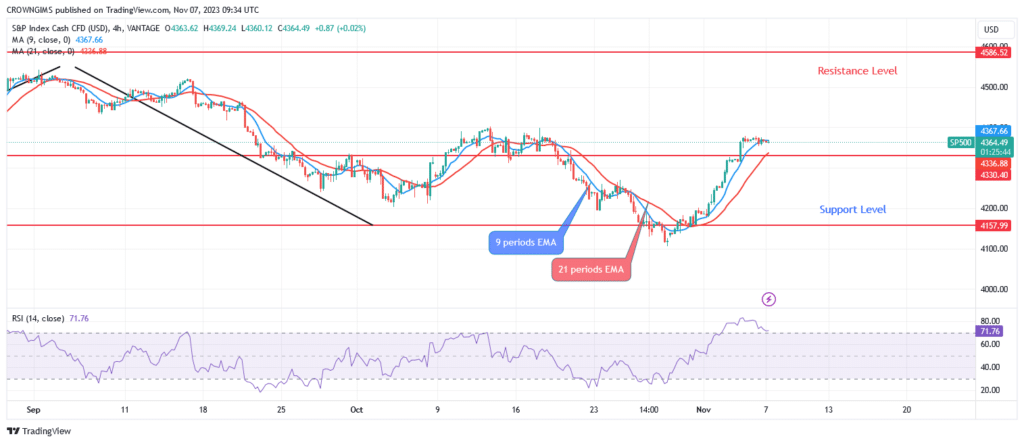
The 21-period EMA and the 9-period EMA are below the price of the S&P 500. The Relative Strength Index period 14 indicates a negative signal at level 71 which may be a pullback.
You can purchase Lucky Block – Guide, Tips & Insights | Learn 2 Trade here. Buy LBLOCK
- Broker
- Min Deposit
- Score
- Visit Broker

- Award-winning Cryptocurrency trading platform
- $100 minimum deposit,
- FCA & Cysec regulated

- 20% welcome bonus of upto $10,000
- Minimum deposit $100
- Verify your account before the bonus is credited
- Fund Moneta Markets account with a minimum of $250
- Opt in using the form to claim your 50% deposit bonus
Learn to Trade
Never Miss A Trade Again

Signal Notification
Real-time signal notifications whenever a signal is opened, closes or Updated

Get Alerts
Immediate alerts to your email and mobile phone.

Entry Price Levels
Entry price level for every signal Just choose one of our Top Brokers in the list above to get all this free.