Key Levels
Resistance Levels: 4710, 4760, and 4800
Support Levels: 4560,4530 and 4500
S&P 500 Price Long-term Trend: Bullish
S&P 500 has been in an upward move up till November 8 but makes a downward correction. Buyers pushed the index to the high of 4714.40 but could not sustain the bullish momentum. The index was repelled after three weeks of a sideways move below the overhead resistance. The currency index fell to the low of level 4492.20. S&P 500 fell above the support of the bullish trend line and above the 21-day line moving average. This propels it to rise on the upside. In December, S&P 500 rose and retested the overhead resistance at level 4713.70. Today, the index is retracing to the downside. S&P 500 will have an accelerated downward move if price breaks below the moving averages.
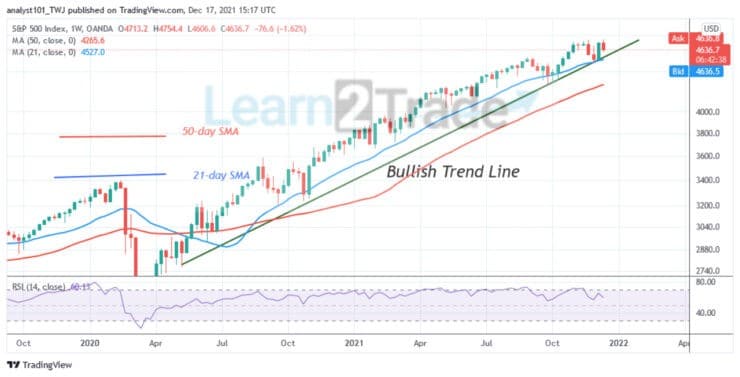
Weekly Chart Indicators Reading:
On the weekly chart, a bullish trend line is drawn showing the support levels of prices. The uptrend is ongoing if prices test and remain above the bullish trend line. However, if price breaks and closes below the trend line, it is assumed the uptrend is terminated. The price bars are above the moving averages indicating that the uptrend is ongoing.
S&P 500 Medium-term Trend: Ranging
On the Daily chart, S&P 500 is in a sideways trend. On November 8, the uptrend was interrupted as the index was compelled to a sideways move. On November 26, S&P 500 faced strong rejection as prices fell and broke below the moving averages. The bulls promptly recovered from the downtrend. The recovery was short-lived as it faced rejection on December 16. The index has fallen but it is trading between the moving averages.
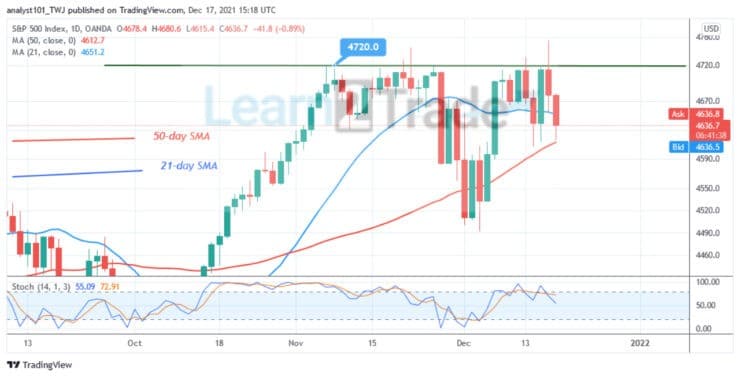
Daily Chart Indicators Reading
It is below the 80% range of the daily stochastic. The market is in a bearish momentum. The index price is below the 21-day line moving average but above the 50-day line moving average indicating a sideways trend.
General Outlook for S&P 500
S&P 500 is in a sideways trend but makes a downward correction. The uptrend will commence if buyers breach the overhead resistance at level 4720. Presently, it is in downward correction. Buyers will have to push the index to the bullish trend zone.
You can purchase crypto coins here: Buy Coins
Note: Learn2.Trade is not a financial advisor. Do your research before investing your funds in any financial asset or presented product or event. We are not responsible for your investing results
- Broker
- Min Deposit
- Score
- Visit Broker

- Award-winning Cryptocurrency trading platform
- $100 minimum deposit,
- FCA & Cysec regulated

- 20% welcome bonus of upto $10,000
- Minimum deposit $100
- Verify your account before the bonus is credited
- Fund Moneta Markets account with a minimum of $250
- Opt in using the form to claim your 50% deposit bonus
Learn to Trade
Never Miss A Trade Again

Signal Notification
Real-time signal notifications whenever a signal is opened, closes or Updated

Get Alerts
Immediate alerts to your email and mobile phone.

Entry Price Levels
Entry price level for every signal Just choose one of our Top Brokers in the list above to get all this free.