S&P 500 Price Analysis – October 27
The S&P 500 index failed to sustain an upside run, falling from an all-time high of 4,599 to 4,557 in early Wednesday trading. Aside from the Fed’s tapering tantrums, there is a cautious mood ahead of the critical advance estimate of US Q3 GDP.
Key Levels
Resistance Levels: 4700, 4650, 4600
Support Levels: 4551, 4500, 4465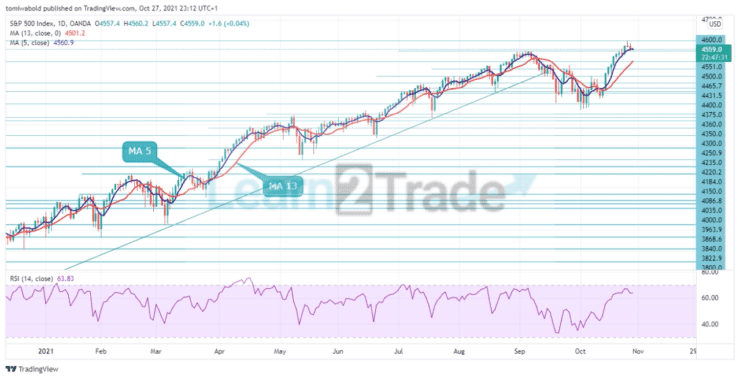
The S&P 500 encountered resistance at 4585, with the next weekly high restraining upside near 4600. On the way up, the bulls are likely to face a few small roadblocks. At 4551 levels, strong support could jeopardize the bears’ engagement.
The support cluster, on the other hand, is located around 4500 levels, which is higher than the previous month’s convergence. If the latter is breached, the support at level 4465, which is the confluence of the moving average 5 and 13, followed by the ascending trendline support, may be tried.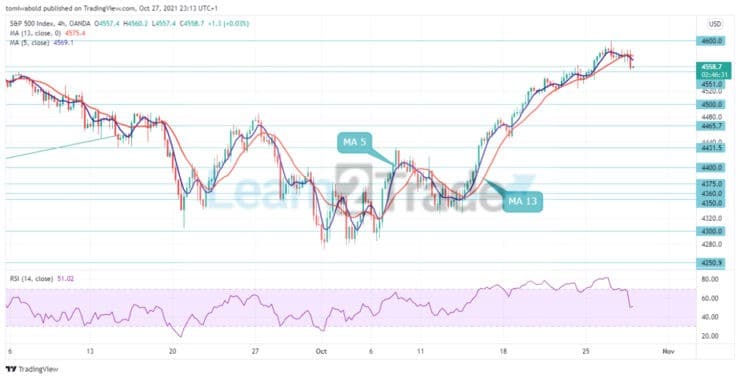
On the 4-hour time frame, the technical analysis context of the S&P 500 index is currently in a very fascinating zone. A break above the 4600 levels would be bullish, but a break below the 4551 levels at the horizontal support line would keep the uptrend unstable.
Examining the signs from the previous session, they showed a bullish push forward. Though dropping, the relative strength stays above 50 midlines. Both the 5 and 13 moving averages have tilted lower and may be approaching a crossover past the 4551 levels.
Note: Learn2.trade is not a financial advisor. Do your research before investing your funds in any financial asset or presented product or event. We are not responsible for your investing results
- Broker
- Min Deposit
- Score
- Visit Broker

- Award-winning Cryptocurrency trading platform
- $100 minimum deposit,
- FCA & Cysec regulated

- 20% welcome bonus of upto $10,000
- Minimum deposit $100
- Verify your account before the bonus is credited
- Fund Moneta Markets account with a minimum of $250
- Opt in using the form to claim your 50% deposit bonus
Learn to Trade
Never Miss A Trade Again

Signal Notification
Real-time signal notifications whenever a signal is opened, closes or Updated

Get Alerts
Immediate alerts to your email and mobile phone.

Entry Price Levels
Entry price level for every signal Just choose one of our Top Brokers in the list above to get all this free.