S&P 500 Price Analysis – June 16
Following a U-turn from the all-time high, S&P 500 index is trading around in a 4235-50 range. The risk index, on the other hand, is based on US Treasury yields and depicts lethargic markets ahead of the critical US Federal Open Market Committee (FOMC) meeting.
Key Levels
Resistance Levels: 4400 4300, 4250
Support Levels: 4220, 4150, 4086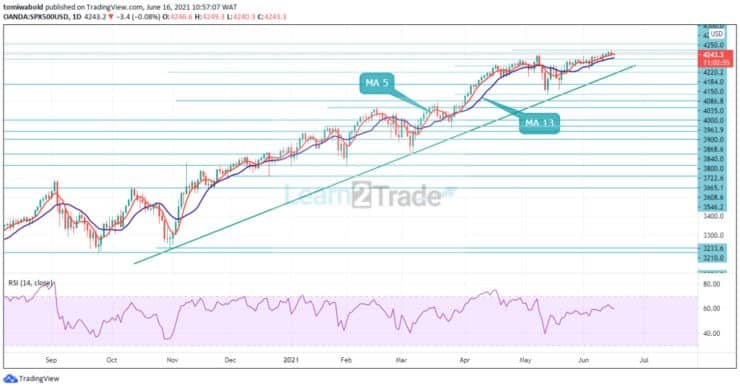
On the daily charts, the advance seems limited by the horizontal barrier at 4250, and the index may try to break through the resistance level. Meanwhile, if the bulls are unable to reclaim control at this point, a 38.2 percent retracement is possible.
The longer-term bias remains cautiously upwards, with first resistance at 4300, which must be overcome to clear the way for a move into 4500 levels. However, we may witness a more difficult test of a cluster of projection levels in the 4250/4300 zone in the future.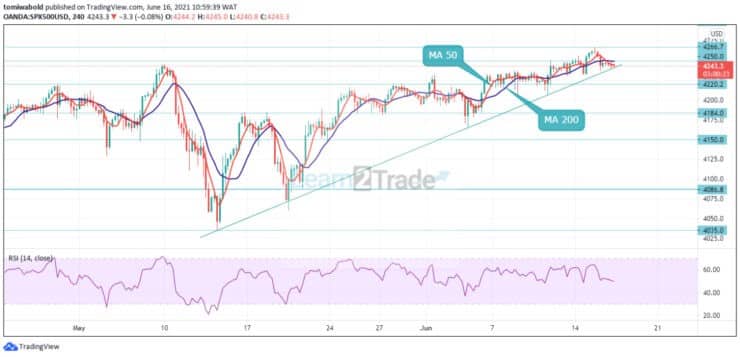
On the 4-hour time frame, the S&P 500 index is in a range trend, which suggests intra-day trades can be determined based on the larger time frame’s trend. The price has established a ranging pattern on the 4-hour time frame, and they usually break in the direction of the present trend.
The RSI is now trading at its midpoints; but, if it breaks below, it could signal that the bears are about to start their party, implying more weakness ahead. Short positions underneath 4220 levels are preferred, with targets at 4184 and 4150 in extension. Alternatively, we see 4266 and 4300 as targets for further gains.
Note: Learn2.Trade is not a financial advisor. Do your research before investing your funds in any financial asset or presented product or event. We are not responsible for your investing results
- Broker
- Min Deposit
- Score
- Visit Broker

- Award-winning Cryptocurrency trading platform
- $100 minimum deposit,
- FCA & Cysec regulated

- 20% welcome bonus of upto $10,000
- Minimum deposit $100
- Verify your account before the bonus is credited
- Fund Moneta Markets account with a minimum of $250
- Opt in using the form to claim your 50% deposit bonus
Learn to Trade
Never Miss A Trade Again

Signal Notification
Real-time signal notifications whenever a signal is opened, closes or Updated

Get Alerts
Immediate alerts to your email and mobile phone.

Entry Price Levels
Entry price level for every signal Just choose one of our Top Brokers in the list above to get all this free.