Highlights
Solana overs above $180
SOL/USD resumes uptrend
Solana (SOL) Current Statistics
The current price: $195.71
Market Capitalization: $99,929,822,277
Trading Volume: $3,617,837,210
Major supply zones: $280, $300, $320
Major demand zones: $160, $140, $120
Solana (SOL) Price Analysis December 6, 2021
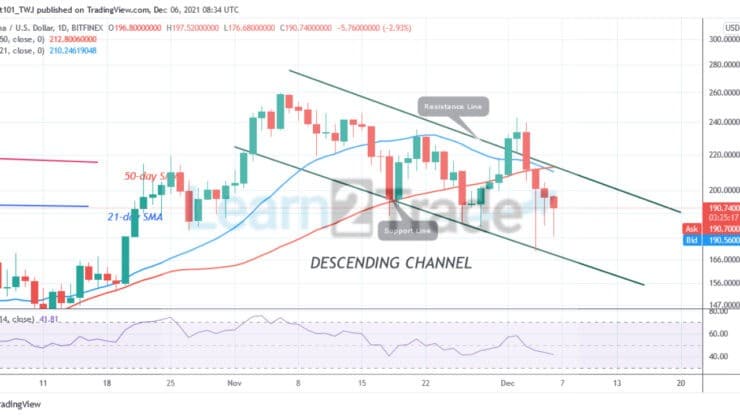
Solana’s (SOL) price is still in the bearish trend zone. The cryptocurrency fell to the low of $176 but pulled back. The candlestick’s tail is pointing and retesting the previous low at $180. The long candlestick’s tail indicates that the current support is a strong buying pressure. The current support has been holding since October 27. The market will resume an upward move if the current support holds.
Solana (SOL) Technical Indicators Reading
Solana is still at level 41 of the Relative Strength index period 14. It indicates that the cryptocurrency is in the downtrend zone and capable of a further downward move. The altcoin has a bearish crossover. That is, the 21-day moving average line crosses below the 50-day moving line.
Conclusion
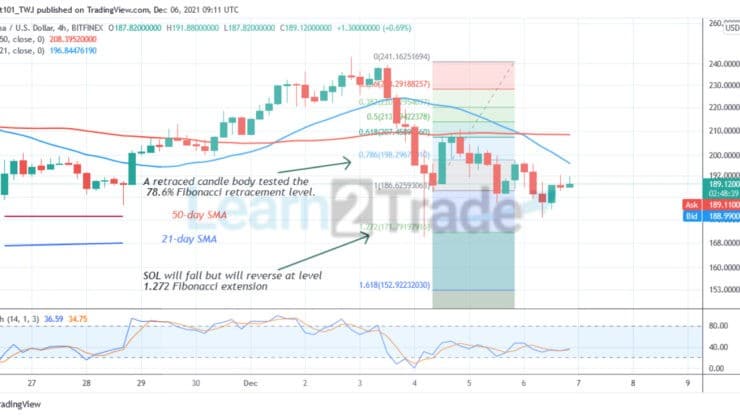
On the 4 hour chart, the downtrend has subsided as the market consolidates above the $180 support. The altcoin is fluctuating between the $176 and $200 price levels. Meanwhile, on December 4 downtrend; a retraced candle body tested the 78.6% Fibonacci retracement level. The retracement indicates that Solana will fall to level 1.272 Fibonacci extensions or $171.79. From the price action, the altcoin has reversed to the range-bound zone.
You can purchase crypto coins here. Buy Tokens
Note: Learn2.Trade is not a financial advisor. Do your research before investing your funds in any financial asset or presented product or event. We are not responsible for your investing
- Broker
- Min Deposit
- Score
- Visit Broker

- Award-winning Cryptocurrency trading platform
- $100 minimum deposit,
- FCA & Cysec regulated

- 20% welcome bonus of upto $10,000
- Minimum deposit $100
- Verify your account before the bonus is credited
- Fund Moneta Markets account with a minimum of $250
- Opt in using the form to claim your 50% deposit bonus
Learn to Trade
Never Miss A Trade Again

Signal Notification
Real-time signal notifications whenever a signal is opened, closes or Updated

Get Alerts
Immediate alerts to your email and mobile phone.

Entry Price Levels
Entry price level for every signal Just choose one of our Top Brokers in the list above to get all this free.