Highlights
Solana retraces to $236 low
SOL/USD rallies to $260 high
Solana (SOL) Current Statistics
The current price: $236.86
Market Capitalization: $121,293,789,737
Trading Volume: $2,391,079,319
Major supply zones: $280, $300, $320
Major demand zones: $160, $140, $120
Solana (SOL) Price Analysis November 15, 2021
Solana’s (SOL) price has been trading above the moving averages. The market is retracing to the support above the 21-day SMA. The uptrend will resume if the price finds support above 21-day SMA. Meanwhile, on October 25 uptrend, a retraced candle body tested the 50% Fibonacci retracement level. The retracement indicates that Solana will rise to level 2.0 Fibonacci extension or $287.92.
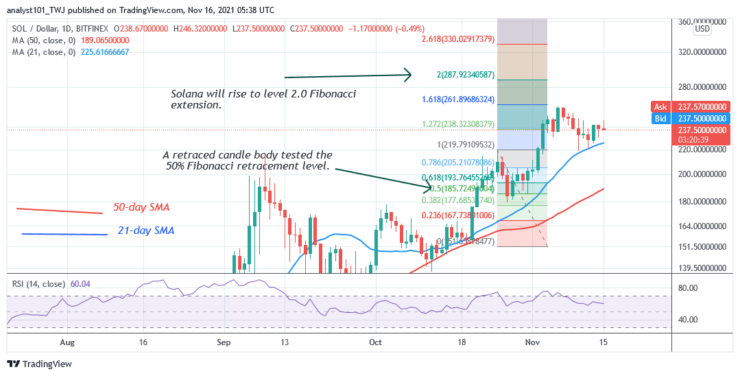
Solana (SOL) Technical Indicators Reading
Solana is at level 60 of the Relative Strength index period 14.SOL is in the bullish trend zone and capable of a further upward move. Solana is below the 20% range of the daily stochastic. The market has fallen to the oversold region.
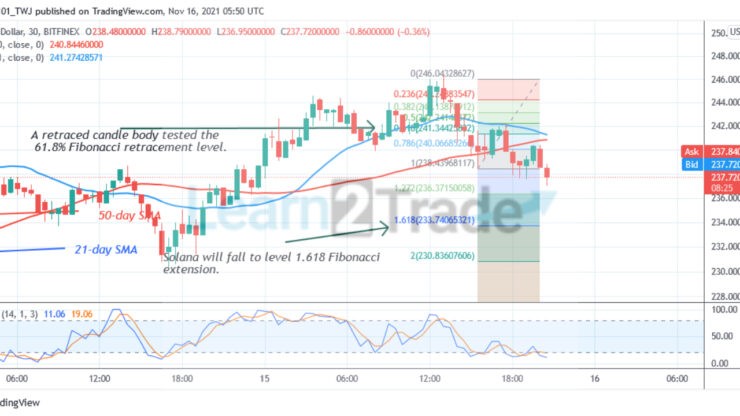
Conclusion
On the 30- Mins chart, Solana has been in a downward move. The cryptocurrency has fallen to the oversold region. Meanwhile, on November 15 downtrend; a retraced candle body tested the 6.8% Fibonacci retracement level. The retracement indicates that Solana will fall to level 1.618 Fibonacci extensions or $233.74.
You can purchase crypto coins here. Buy Tokens
Note: Learn2.Trade is not a financial advisor. Do your research before investing your funds in any financial asset or presented product or event. We are not responsible for your investing
- Broker
- Min Deposit
- Score
- Visit Broker

- Award-winning Cryptocurrency trading platform
- $100 minimum deposit,
- FCA & Cysec regulated

- 20% welcome bonus of upto $10,000
- Minimum deposit $100
- Verify your account before the bonus is credited
- Fund Moneta Markets account with a minimum of $250
- Opt in using the form to claim your 50% deposit bonus
Learn to Trade
Never Miss A Trade Again

Signal Notification
Real-time signal notifications whenever a signal is opened, closes or Updated

Get Alerts
Immediate alerts to your email and mobile phone.

Entry Price Levels
Entry price level for every signal Just choose one of our Top Brokers in the list above to get all this free.