Don’t invest unless you’re prepared to lose all the money you invest. This is a high-risk investment and you are unlikely to be protected if something goes wrong. Take 2 minutes to learn more
Price action in the Solana market surpassed the $120 mark about four sessions ago as bulls courageously entered bear territory, hoping to continue their onslaught. However, the opposite has occurred, and the token continues to trade above the $100 mark.
Key SOL Statistics:
Current Solana value: $105.40
Solana Market Cap: $46,285,442,785
SOL Circulating Supply: 429,180,175
SOL Total Supply: 565,884,954
Solana CoinMarketCap Ranking: 5
Key Price Levels:
Resistance: $105.40, $107.00, and $110.00
Support: $105.00, $103.00, and $101.00
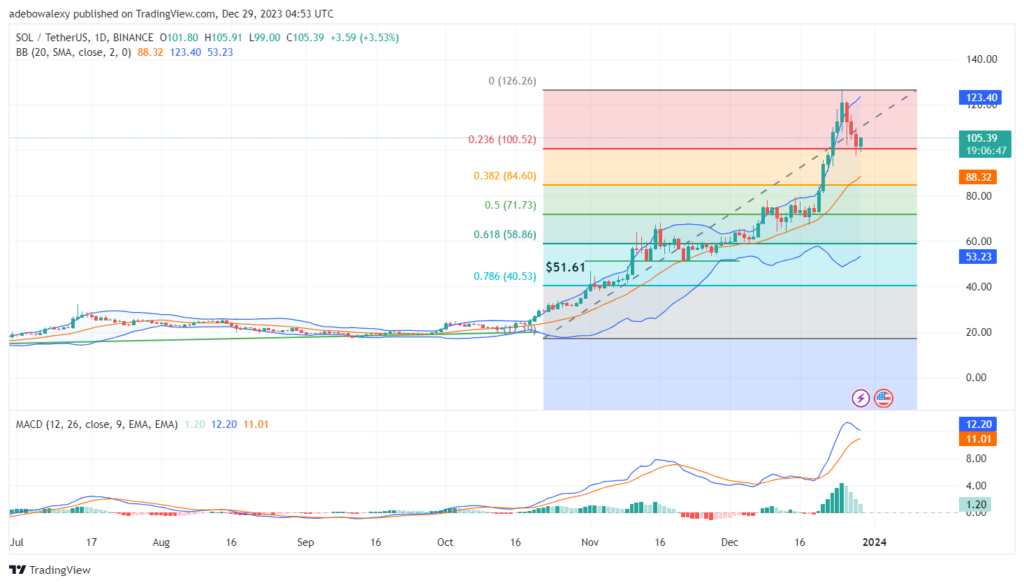
The $100 Support Level Seems to be Holding Quite Well in the Solana Market
As earlier stated, price activity in the SOL daily market had earlier surpassed the $120 mark. However, a downward correction occurred with almost the same volatility as during the recent price increase. The downward correction spanned three consecutive sessions.
Nevertheless, the ongoing session seems to have shown that buyers are defending the $100 support line, as a green price candle appeared. Also, this occurred at a significant distance above the middle limit of the Bollinger Bands indicator. Meanwhile, the lines of the Moving Average Convergence Divergence (MACD) have been approaching a bearish crossover above the equilibrium level but seem to be slowing down following the bounce off the $100 support.
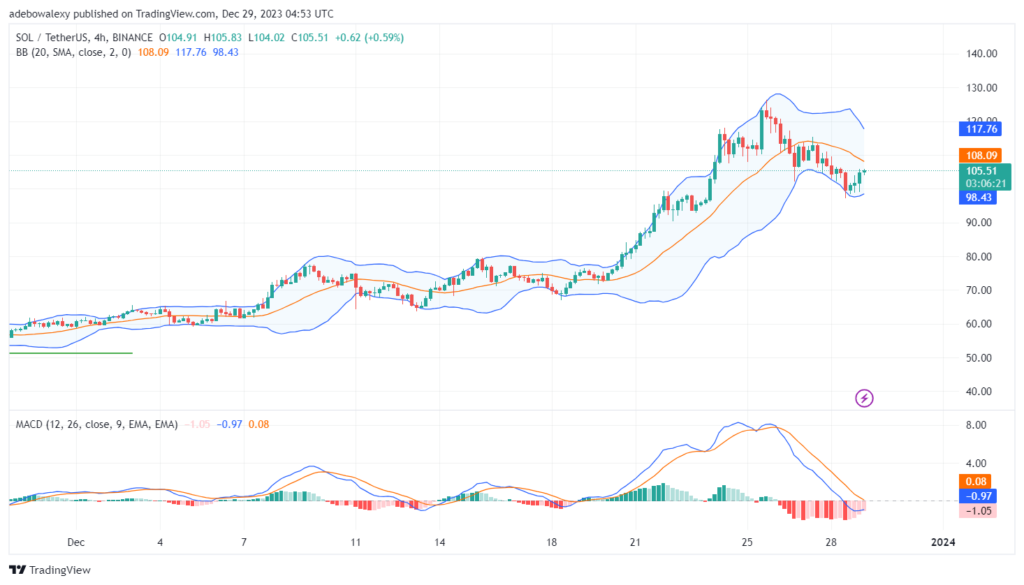
SOL Keeps Recording Consistent But Minimal Profits
In the Solana 4-hour market, we can see that price action has been printing minimal profits ever since it rebounded off the support at the $100 mark. The ongoing session has yet to yield only minimal profits. However, with that, price action in this market is now focusing on the $108.10 mark, which aligns with the middle limit of the Bollinger Bands of the indicator.
Meanwhile, the MACD indicator lines are still converging for a bullish crossover, and the bars of this indicator are pale red in appearance, pointing out that there is a decline in momentum. Therefore, should price action retrace to the $108.10 price mark, traders can then hope for it to revisit the $120 mark.
Trade crypto coins on AvaTrade
- Broker
- Min Deposit
- Score
- Visit Broker

- Award-winning Cryptocurrency trading platform
- $100 minimum deposit,
- FCA & Cysec regulated

- 20% welcome bonus of upto $10,000
- Minimum deposit $100
- Verify your account before the bonus is credited
- Fund Moneta Markets account with a minimum of $250
- Opt in using the form to claim your 50% deposit bonus
Learn to Trade
Never Miss A Trade Again

Signal Notification
Real-time signal notifications whenever a signal is opened, closes or Updated

Get Alerts
Immediate alerts to your email and mobile phone.

Entry Price Levels
Entry price level for every signal Just choose one of our Top Brokers in the list above to get all this free.