Don’t invest unless you’re prepared to lose all the money you invest. This is a high-risk investment and you are unlikely to be protected if something goes wrong. Take 2 minutes to learn more
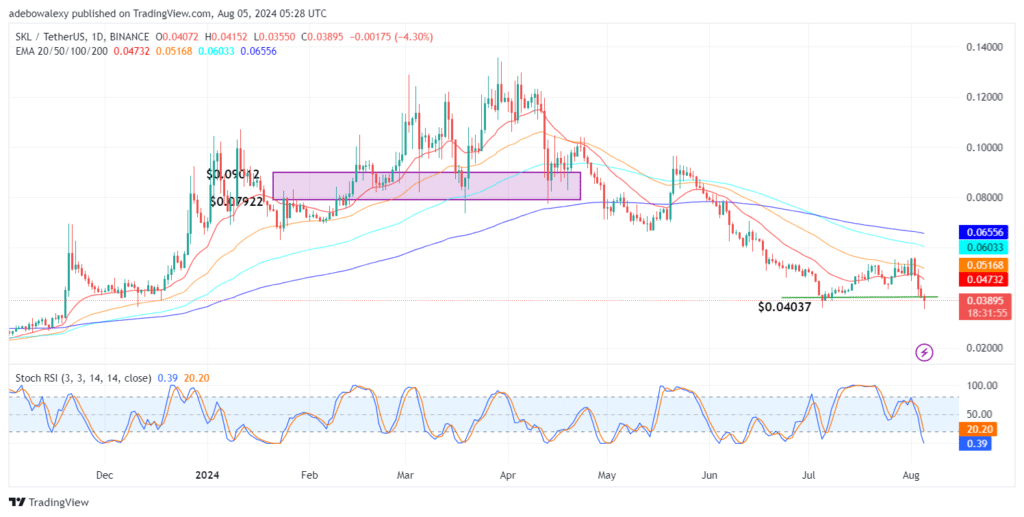
As Bitcoin dips massively, the crypto market has fallen under greater bearish pressure. This has caused the Skale Network token to break the support level at $0.04037. The market still holds bearish prospects, so let’s see what may still be in it for bearish traders.
Key Price Levels:
Resistance: $0.04000, $0.04500, and $0.05000
Support: $0.03500, $0.03200, and $0.02900
Skale Network Trades Below the $0.04000 Mark
As noted above, headwinds have driven the SKL token below a support level that has held for about a month. However, this bearish sentiment isn’t limited to this market but has permeated the crypto market generally. Price activity in this market now occurs below all the Exponential Moving Average (EMA) lines.
Meanwhile, the Stochastic Relative Strength Index (SRSI) curves have also fallen deep into the oversold region. Although the last price candle can be seen having a longer lower shadow, indicating that upside forces are trying to bring the market back up, price action seems heavily burdened by bearish sentiments.
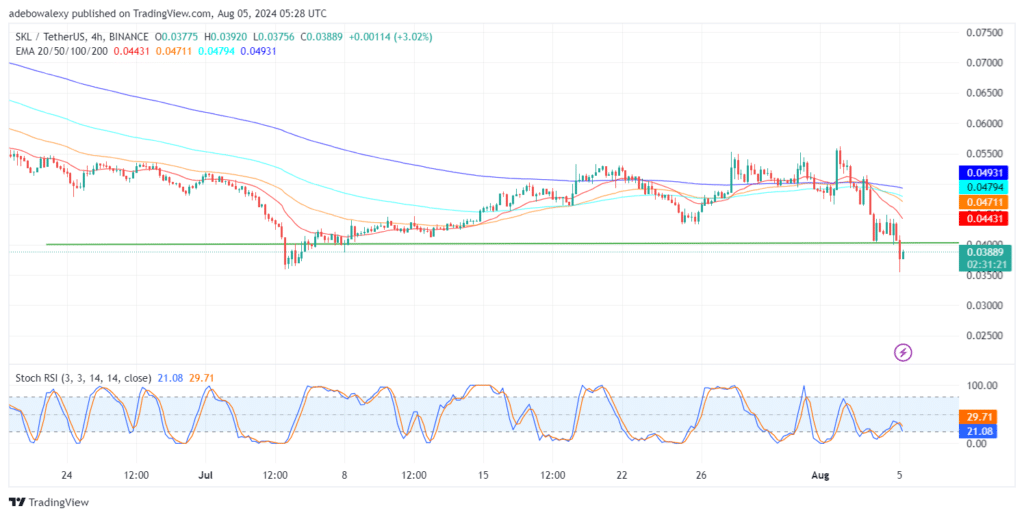
The SKL/USDT Market Attempts a Rebound But Stays Burdened
Price activity in the Skale Network 4-hour market is still under the $0.04000 threshold. The mentioned price level constitutes a technical resistance to price movement. The last price candle on this price chart is green, indicating that upside forces are staging resistance to further price falls.
However, the market still trades below all the EMA lines, which constitutes a heavy burden on the market. The Stochastic Relative Strength Index lines can also be seen sticking to their downward path. Technically, the observed rebound may be thought of as a mere deflection, as traders may still use crypto signals geared towards the $0.03500 mark.
Trade on MT4 with Leverage up to 1:500! Trade on MT4 with Leverage up to 1:500!
X
We use cookies to ensure that we give you the best experience on our website. If you continue to use this site we will assume that you are happy with it.