Don’t invest unless you’re prepared to lose all the money you invest. This is a high-risk investment and you are unlikely to be protected if something goes wrong. Take 2 minutes to learn more
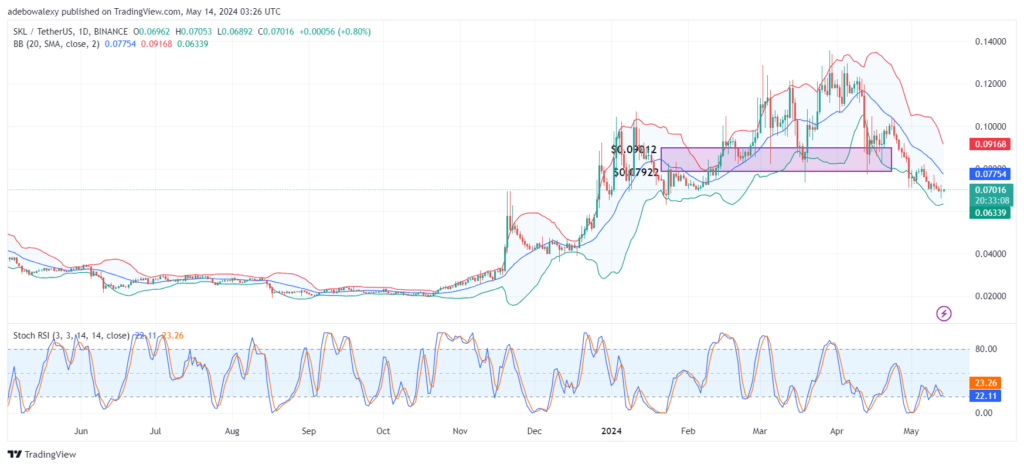
Bearish activity in the Skale Network Market has been dominant, bringing the market towards lower support levels. However, as soon as price action reached the technical level of $0.07000, the downward momentum seemed to halt. The ongoing session has shown signs of the market attempting an upward correction at this point.
Key Price Levels:
Resistance: $0.08000, $0.09000, and $0.1000
Support: $0.07000, $0.06000, and $0.05000
.07000 Mark" width="580" height="265" data-lazy-src="https://learn2.trade/wp-content/uploads/2024/05/SKLUSDT_2024-05-14_04-26-53_042916-1024x467.png"/>
Skale Network Bulls Are Putting Their Foot Down
While headwinds caused a steady and significant downward movement in the SKL daily market, it can be perceived that the market is preparing for a trend reversal. The price candle for the previous session revealed a fierce struggle between market forces, with upside forces eventually prevailing, as indicated by the green appearance of the price candle.
The current session has shown an upward movement, as indicated by the corresponding price candle. Meanwhile, the Relative Strength Index (RSI) lines are now in the oversold region, with the leading line approaching a crossover. Although the trend is still developing, traders can consider using bullish crypto signals at this point.
.07000 Mark" width="580" height="265" data-lazy-src="https://learn2.trade/wp-content/uploads/2024/05/SKLUSDT_2024-05-14_04-27-26_042912-1024x467.png"/>
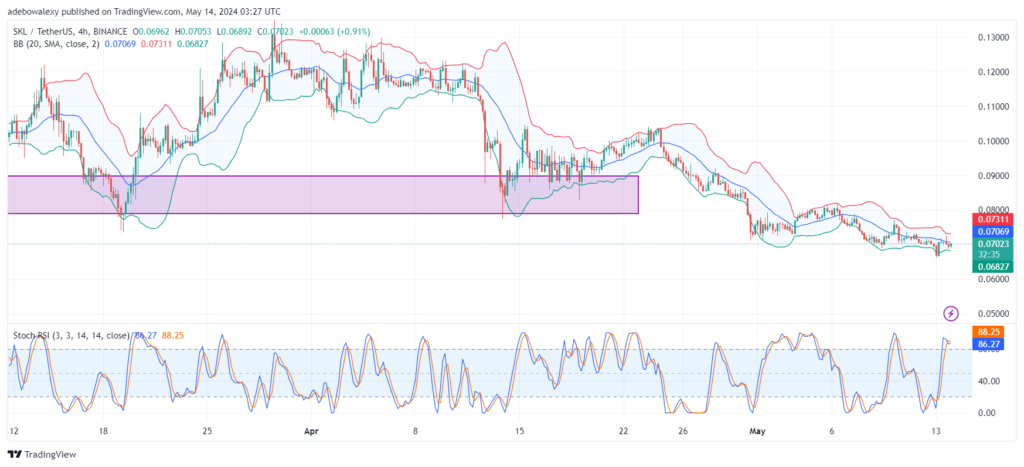
SKL Hopes of Recording More Profits Stay Viable
Price action on the Skale Network4-hour market indicates progress. The market has moved from $0.07016 to $0.07023. Additionally, the last price candle here is closing in on the middle limit of the Bollinger Bands. The SRSI indicator lines have reached the overbought region.
However, these indicator lines have previously shown a downward crossover, but their appearance suggests that another upside crossover may be on the way. Should this occur, price action will surface above the middle limit of the indicator, further brightening hopes of the market rising through the $0.08000 mark shortly.
Trade on MT4 with Leverage up to 1:500! Trade on MT4 with Leverage up to 1:500!
X
We use cookies to ensure that we give you the best experience on our website. If you continue to use this site we will assume that you are happy with it.
 .07000 Mark" width="580" height="265" data-lazy-src="https://learn2.trade/wp-content/uploads/2024/05/SKLUSDT_2024-05-14_04-26-53_042916-1024x467.png"/>