SILVER Price Analysis – February 23
Ability to break up $24 price level by the bulls may increase price further to $25 and $26 levels. Silver price may decrease when the Bulls’ momentum become weak and the price could not breaks up the $24 resistance level, the price may find its support at $23, $22 and $20 levels.
XAGUSD Market
Key Levels:
Resistance levels: $24, $25, $26
Support levels: $23, $22, $20
XAGUSD Long-term trend: Bullish
XAGUSD (Silver) is bullish on the long-term outlook. The white metal is still obeying the command of the triple bottom chart pattern formed two weeks ago. Silver tested the support level of $22 three times. The white metal started to be under the control of the bulls since February 04. The price bounced up from the support level of $22. It increases and break up the resistance level of $23 and currently increasing towards the resistance level of $24.
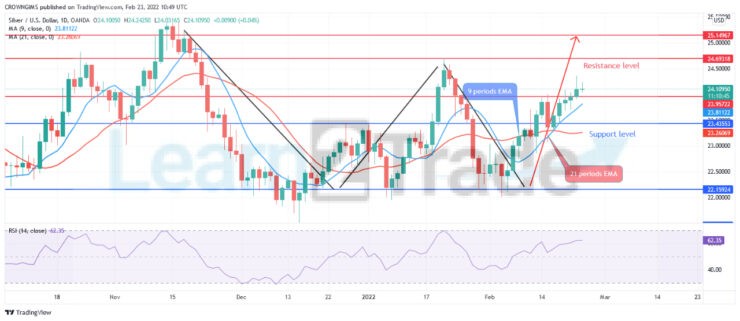
There is an increase in bullish momentum as the Silver price remains above the 9 periods EMA and the 21 periods EMA. The relative strength index period 14 is at 57 levels with the signal lines pointing upside to connote buy signaling. Ability to break up $24 price level by the bulls may increase price further to $25 and $26 levels. Silver price may decrease when the Bulls’ momentum become weak and the price could not breaks up the $24 resistance level, the price may find its support at $23, $22 and $20 levels.
XAGUSD Medium-term Trend: Bullish
XAGUSD is bullish on the daily chart. Last week, the price commenced a bullish trend due to the formation of double bottom chart pattern at the support level of $22. This is a bullish reversal chart pattern. Silver price bounces off the support level of $22 and increase towards the resistance level of $24.
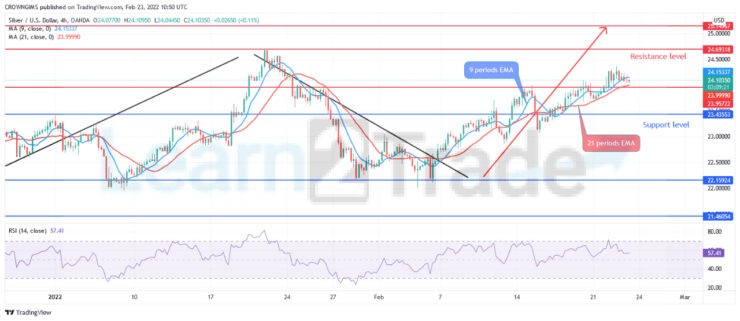
The Silver price is trading above the 9 periods EMA and 21 periods EMA. The relative strength index period 14 is at 57 levels with the signal lines pointing up to indicate buy signal.
You can purchase Lucky Block – Guide, Tips & Insights | Learn 2 Trade here. Buy LBlock:
- Broker
- Min Deposit
- Score
- Visit Broker

- Award-winning Cryptocurrency trading platform
- $100 minimum deposit,
- FCA & Cysec regulated

- 20% welcome bonus of upto $10,000
- Minimum deposit $100
- Verify your account before the bonus is credited
- Fund Moneta Markets account with a minimum of $250
- Opt in using the form to claim your 50% deposit bonus
Learn to Trade
Never Miss A Trade Again

Signal Notification
Real-time signal notifications whenever a signal is opened, closes or Updated

Get Alerts
Immediate alerts to your email and mobile phone.

Entry Price Levels
Entry price level for every signal Just choose one of our Top Brokers in the list above to get all this free.