

Sellers were unable to break down $28 threshold
SILVER Price Analysis – 15 January
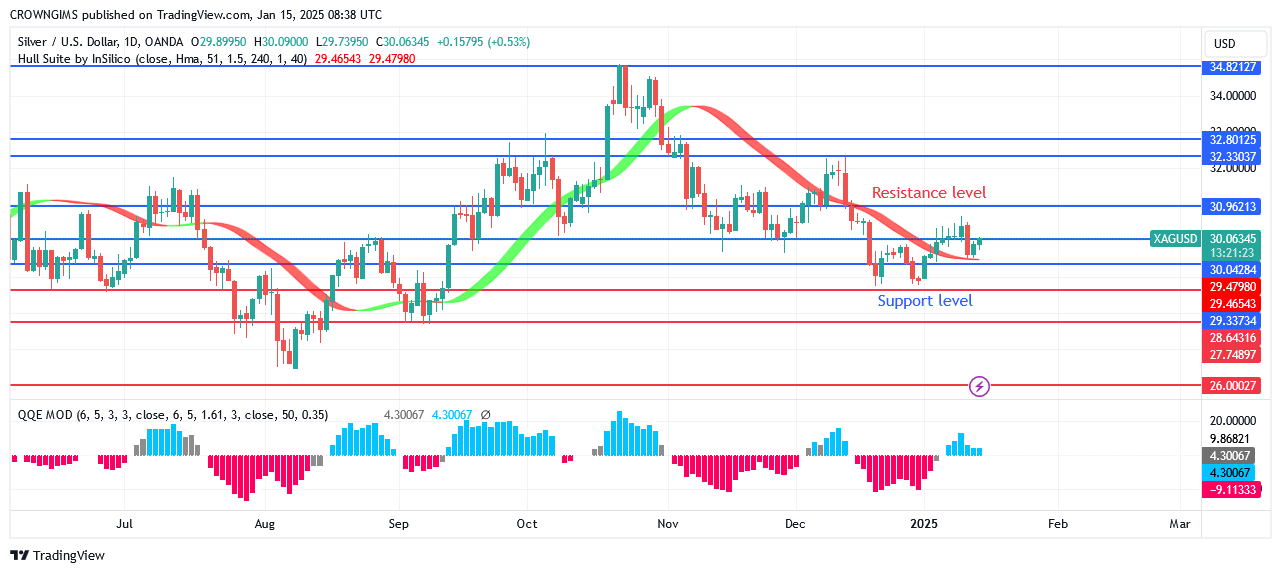
If the price is greater than $30 and a lot of people are purchasing it, it will attempt to move up into the $31–$32 range. The price of silver may drop and test the $28 and $27 support levels if sellers are able to maintain the $30 price level and the $29 support level is breached.
XAGUSD Market
Key Levels:
Resistance levels: $30, $31, $32
Support levels: $29, $28. $27
XAGUSD Long-term trend: Bullish
The daily silver chart shows a positive outlook. For a few weeks, it seemed that sellers ruled the silver market. Prices dropped $29 from the previous month as a result of an increase in sellers’ demand. When buying continued on the level and bears intervened to halt them, the white metal touched its previous low of $29 as well. Because the bulls’ momentum appears to be robust, there has been bullish activity for the past week. When the market hit the $29 barrier level, a double bottom chart pattern emerged, and the market started to rise. The price trend is rising toward $30.
XAGUSD Medium-term Trend: Bullish
The XAGUSD’s 4-hour chart shows an inclining trend. Near the $28 barrier level, a double bottom chart pattern appeared, signaling a significant change in direction. The first obstacle to silver’s slide is the $30 mark. It was forbidden to go beyond the predetermined price cutoff threshold. Costs are currently about $30 per unit due to high consumer purchasing power.
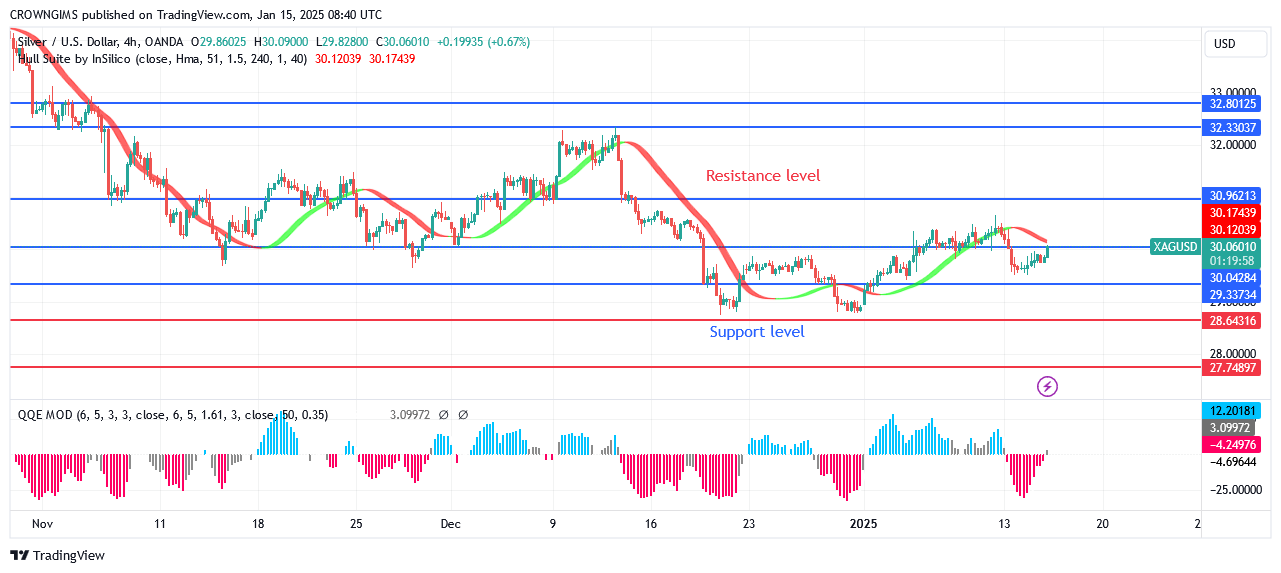 Silver is currently trading close to significant dynamic support levels. The QQE MOD has more instances of the buy directive.
Start using a world-class auto trading solution
You can purchase Lucky Block here. Buy LBLOCK


