Bears may continue pushing lower
Shiba Inu (SHIB) Price Analysis: 21 September
If buyers can push the price over the $0.000012 mark, the price might be able to break through the resistance levels of $0.000013 and $0.000015, respectively. If sellers are successful in holding the cryptocurrency, the price may drop below $0.000011 and try to test the support levels of $0.000010 and $0.000009, respectively.
Key Levels:
Resistance Levels: $0.000012, $0.000013, $0.000015
Support Levels: $0.000011, $0.000010, $0.000009
SHIBUSD
Long-term Trend: Bearish
A definite bearish reversal indicator can be seen on the Shiba Inu daily chart. Sellers have controlled the SHIB market since July 21. At $0.000015, the price crossed the threshold. Indicators of selling power in the market were frequently negative candlestick patterns. The bears’ fervor caused the price to fall below $0.000013. $0.000012 was one of the tested points. Following evaluation at the proper level of support, the buyer’s choice was added to the transaction. At the moment, the market is clearly in a downward trend near the $0.000011 barrier level. Sellers take control of the price after it surpasses the starting point and continue to push it until it breaks by $0.000012.
 .000012 Line" width="1281" height="571" data-lazy-src="https://learn2.trade/wp-content/uploads/2025/09/Daily-63.png"/>
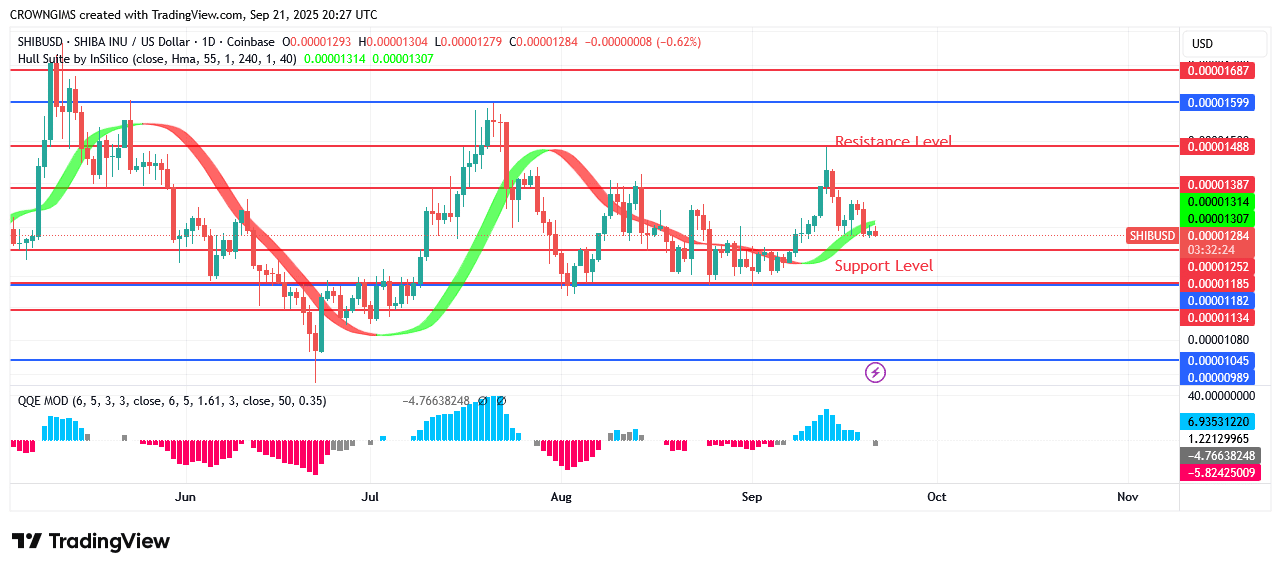
The present SHIB cost satisfies the Hull Suite indication. If buyers can push the price over the $0.000012 mark, the price might be able to break through the resistance levels of $0.000013 and $0.000015, respectively. If sellers are successful in holding the cryptocurrency, the price may drop below $0.000011 and try to test the support levels of $0.000010 and $0.000009, respectively.
SHIBUSD Price Medium-term Trend: Bearish
Shiba Inus’s four-hour price drop is displayed in the pricing chart. Over the past week, the currency has been bought and traded for less than $0.000013. Customers continue to frequent the stores in spite of the price reduction. The price falls below the $0.000012 barrier once more after rising above it. After the 4-hour candle closed above $0.000012, the price tested $0.000013.
.000012 Line" width="1281" height="571" data-lazy-src="https://learn2.trade/wp-content/uploads/2025/09/4-hours-53.png"/>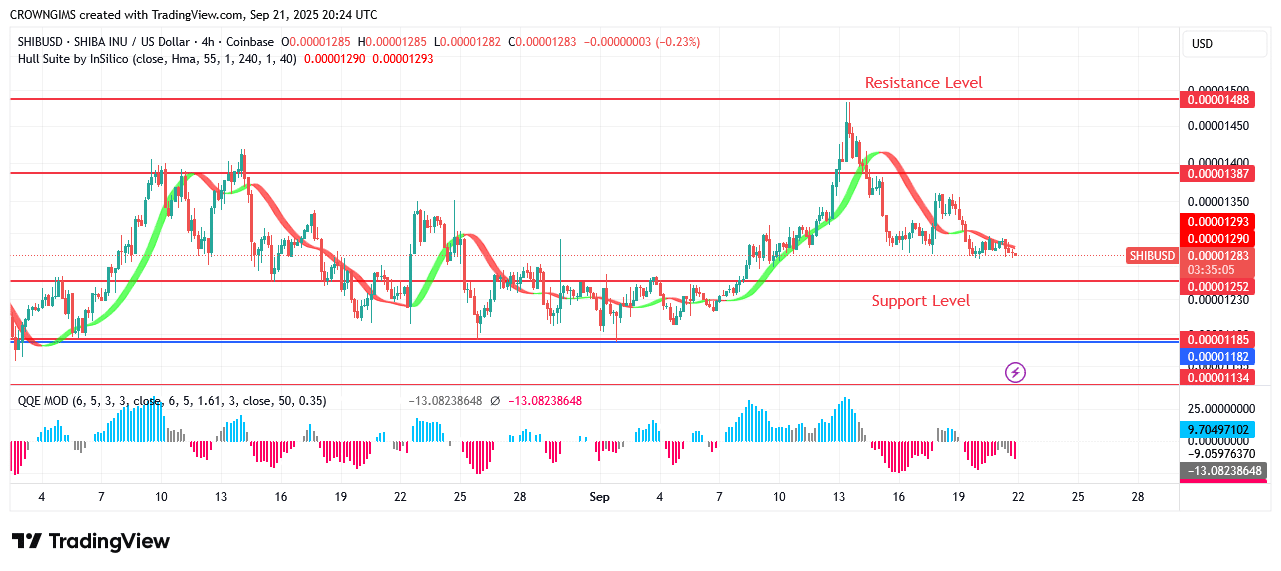
Start using a world-class auto trading solution
You can purchase Lucky Block here. Buy LBLOCK
- Broker
- Min Deposit
- Score
- Visit Broker

- Award-winning Cryptocurrency trading platform
- $100 minimum deposit,
- FCA & Cysec regulated

- 20% welcome bonus of upto $10,000
- Minimum deposit $100
- Verify your account before the bonus is credited
- Fund Moneta Markets account with a minimum of $250
- Opt in using the form to claim your 50% deposit bonus
Learn to Trade
Never Miss A Trade Again

Signal Notification
Real-time signal notifications whenever a signal is opened, closes or Updated

Get Alerts
Immediate alerts to your email and mobile phone.

Entry Price Levels
Entry price level for every signal Just choose one of our Top Brokers in the list above to get all this free.