SHIB may increase further
Shiba Inu (SHIB) Price Analysis: 13 August
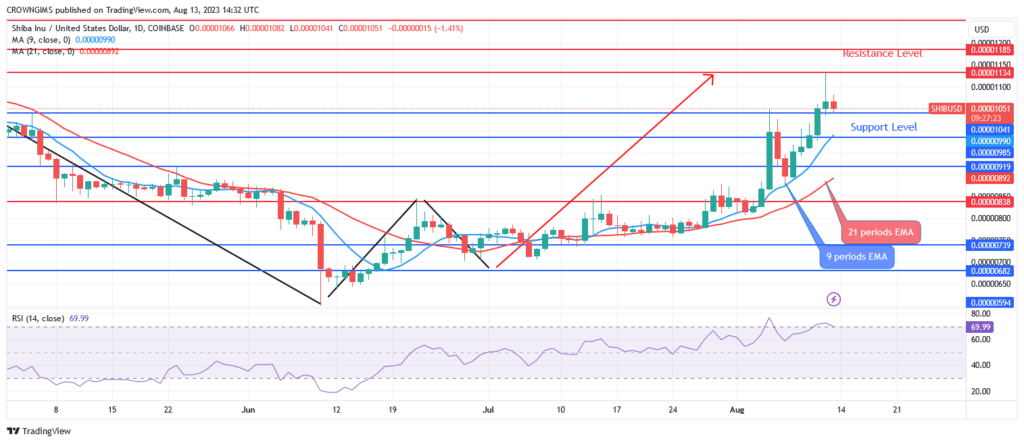
Shiba Inu may breach the $0.00001134 resistance level and test the $0.00001185 and $0.00001252 levels if buyers maintain their zeal. The price of the cryptocurrency may drop below $0.00001041 and approach the support levels of $0.00000985 and $0.00000920 if bears are successful in holding the $0.00001134 level. The relative strength index period 14 at level 69 gives a buy signal.
Key Levels:
Resistance Levels: $0.00001134, $0.00001185, $0.00001252
Support Levels: $0.00001041, $0.00000985, $0.00000920
SHIBUSD Long-term Trend: Bullish
Shiba Inu is bullish on the daily chart. Last week, there was a further increase in the SHIB price. A short “W” chart pattern was created at the $0.00000594 and $0.00000682 levels of support, this triggered a bullish movement. The earlier resistance level of $0.00000920 was broken upward in this market, which is dominated by bulls. After breaking through the $0.00000985 level of resistance, the bulls’ momentum continued to build, putting the high of $0.00001134 to the test. The market is currently pulling back.

After the 9-period EMA crossed above the 21-period EMA, SHIB continued to trade above the two EMAs. If buyers maintain their zeal, the price may breach the $0.00001134 resistance level and test the $0.00001185 and $0.00001252 levels. The cost of the cryptocurrency may drop below $0.00001041 and approach the support levels of $0.00000985 and $0.00000920 if bears are successful in holding the $0.00001134 level. The relative strength index period 14 at level 69 gives a buy signal.
SHIBUSD Price Medium-term Trend: Bullish
Shiba Inu’s 4-hour chart reveals a rising trend. The cryptocurrency’s value increased over $0.00000739 during the last three weeks since purchasing outnumbered selling. SHIB rose because of the enthusiasm of the buyers at the aforementioned level, breaking over the resistance level of $0.00000920 to reach $0.0000134. Right now, the price is retesting $0.00001041 level.

Shiba Inu currently trades between the 9- and 21-period exponential moving averages indicating a bearish market. The 59 levels of the Relative Strength Index indicate a sell, which may be a pullback.
You can purchase Lucky Block – Guide, Tips & Insights | Learn 2 Trade here. Buy LBLOCK
- Broker
- Min Deposit
- Score
- Visit Broker
- Award-winning Cryptocurrency trading platform
- $100 minimum deposit,
- FCA & Cysec regulated
- 20% welcome bonus of upto $10,000
- Minimum deposit $100
- Verify your account before the bonus is credited
- Fund Moneta Markets account with a minimum of $250
- Opt in using the form to claim your 50% deposit bonus
Learn to Trade
Never Miss A Trade Again

Signal Notification
Real-time signal notifications whenever a signal is opened, closes or Updated

Get Alerts
Immediate alerts to your email and mobile phone.

Entry Price Levels
Entry price level for every signal Just choose one of our Top Brokers in the list above to get all this free.


