Key Resistance Zones: 3300, 3400, 3500
Key Support Zones: 2800, 2700, 2600
Shanghai SE Composite Index (SHCOMP) Long-term Trend: Ranging
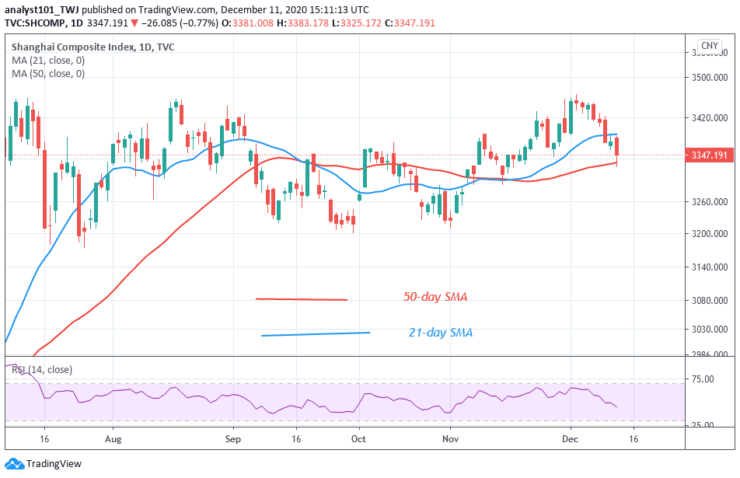
SHCOMP has been fluctuating between levels 3200 and 3400 since July. The index has risen to level 3457. Presently, it is making a downward move. The price has broken the 21-day SMA but approaching the 50-day SMA. A break below the SMAs will mean a further downward move.
Daily Chart Indicators Reading:
SHCOMP has risen to level 44 of the Relative Strength Index period 14. The index is in the uptrend zone and above the centerline 50. The 21-day SMA and 50-day SMA are sloping sideways indicating the sideways trend.
Shanghai SE Composite Index (SHCOMP) Medium-term Trend: Bearish
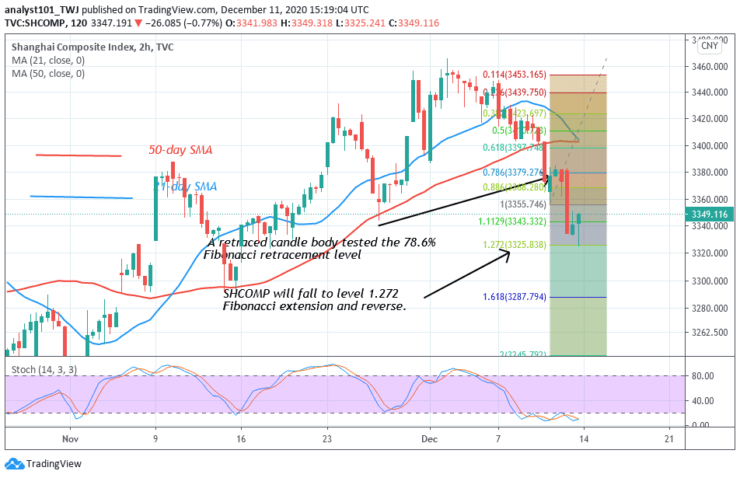
On the 4- hour chart, the index is in a downward move. On December 11 downtrend; a retraced candle body tested the 78.6% Fibonacci retracement level. The retracement indicates that the index will fall and reverse at level 1.272 Fibonacci extensions or level 3325.838.
4-hour Chart Indicators Reading
SHCOMP is below the 20% range of the daily stochastic. It indicates that the market is in a bearish momentum. The 21-day SMA and the 50-day SMA are sloping upward indicating the uptrend.
General Outlook for Shanghai SE Composite Index (SHCOMP)
SHCOMP has continued to fluctuate in a confined range. Presently, the index is falling to a lower price range. According to the Fibonacci tool, the downtrend is expected to reach level 3325.838 and reverse.
Note: Learn2.Trade is not a financial advisor. Do your research before investing your funds in any financial asset or presented product or event. We are not responsible for your investing results
- Broker
- Min Deposit
- Score
- Visit Broker

- Award-winning Cryptocurrency trading platform
- $100 minimum deposit,
- FCA & Cysec regulated

- 20% welcome bonus of upto $10,000
- Minimum deposit $100
- Verify your account before the bonus is credited
- Fund Moneta Markets account with a minimum of $250
- Opt in using the form to claim your 50% deposit bonus
Learn to Trade
Never Miss A Trade Again

Signal Notification
Real-time signal notifications whenever a signal is opened, closes or Updated

Get Alerts
Immediate alerts to your email and mobile phone.

Entry Price Levels
Entry price level for every signal Just choose one of our Top Brokers in the list above to get all this free.