Don’t invest unless you’re prepared to lose all the money you invest. This is a high-risk investment and you are unlikely to be protected if something goes wrong. Take 2 minutes to learn more
Although the SEIUSDT token’s price has been driven significantly downward by headwinds, the token currently stands above its launch price. This illustrates the fact that early investors in the crypto industry often make profits in the long run. This token has seen an additional 2.59% price increase. While this increase may seem small, let’s further examine the market.
SEI Statistics:
Current Sei Value: $0.3188
SEI Market Cap: $977,182,315
SEI Circulating Supply: 3,050,000,000 SEI
SEI Total Supply: 10,000,000,000 SEI
Sei CoinMarketCap Rank: 68
Key Price Levels:
Resistance: $0.3500, $0.4500, and $0.5500
Support: $0.3000, $0.2500, and $0.2000
.3100 Support" width="580" height="308" data-lazy-src="https://learn2.trade/wp-content/uploads/2024/07/SEIUSDT_2024-07-12_06-51-57_065624-1024x543.png"/>
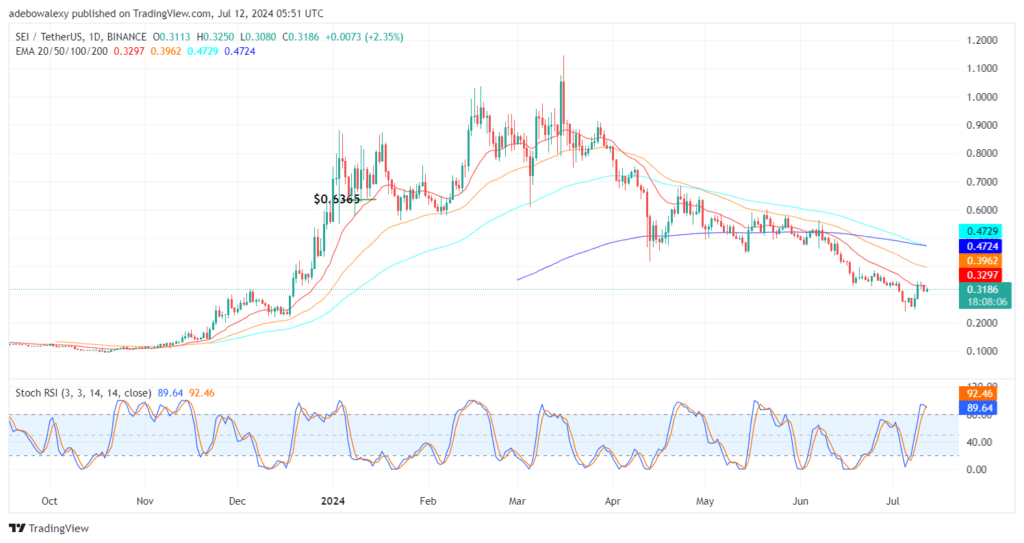
SEIUSDT Still Looks Pressured Despite Gaining 2.59% on the Day
Price activity in the Sei market can be seen recoiling smoothly off the resistance formed by the 20-day Exponential Moving Average (EMA) lines. Today’s trading has brought minimal upside recovery, but the EMA lines lie heavily overhead. Consequently, this constitutes a significant challenge for upward movement in this market.
Meanwhile, the Stochastic Relative Strength Index (SRSI) lines haven’t delivered a crossover into the overbought region. However, interestingly, we can see that the indicator’s lines are maintaining an upward trajectory. This appears interesting and warrants further study, as it may suggest that traders are using bullish crypto signals and going against the trend.
.3100 Support" width="580" height="308" data-lazy-src="https://learn2.trade/wp-content/uploads/2024/07/SEIUSDT_2024-07-12_06-52-58_065623-1024x543.png"/>
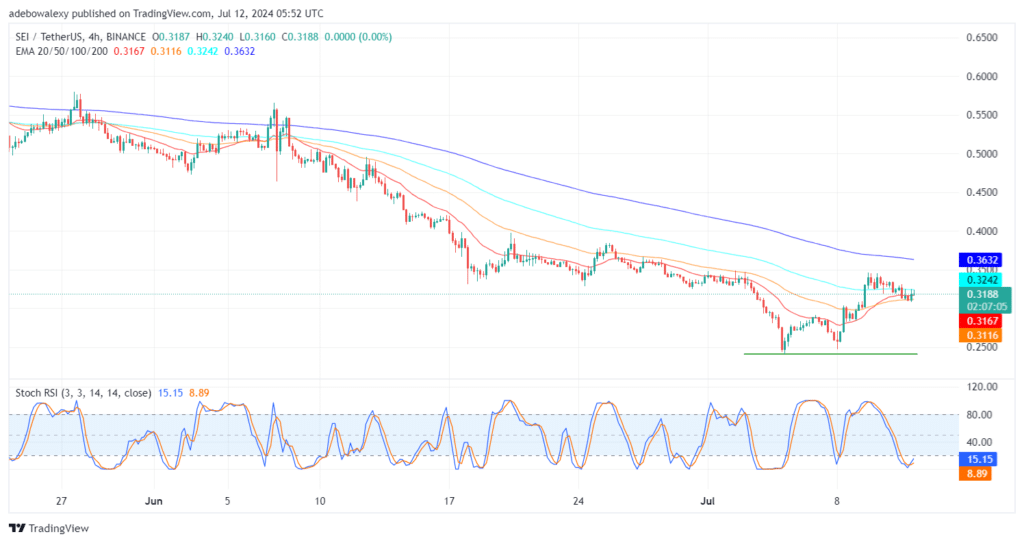
Sei Price Action Is Acquiring Higher Support on the 4-Hour Chart
Looking at the SEIUSDT market in a 4-hour timeframe, it is portrayed that price movement is finding new supports, each one higher than the previous. Technically, this suggests that the market is making upward progress, albeit on a minimal scale. The current session stands above the 20- and 50-day EMA curves, while its upper shadow is testing the 100-day EMA curve.
Simultaneously, it can be observed that the SRSI indicator has delivered an upside crossover in the oversold region. Furthermore, the indicator’s lines have taken on an upward trajectory. This shows that prices have upside potential despite facing an uphill battle. Nevertheless, traders hoping to target price levels above the $0.3500 mark should do so with necessary precautions.
Trade on MT4 with Leverage up to 1:500! Trade on MT4 with Leverage up to 1:500!
X
We use cookies to ensure that we give you the best experience on our website. If you continue to use this site we will assume that you are happy with it.
 .3100 Support" width="580" height="308" data-lazy-src="https://learn2.trade/wp-content/uploads/2024/07/SEIUSDT_2024-07-12_06-51-57_065624-1024x543.png"/>