Quant Price Forecast: December 29
The Quant price forecast is for the market to continue its upward movement in consolidation after it recovers from a retracement.
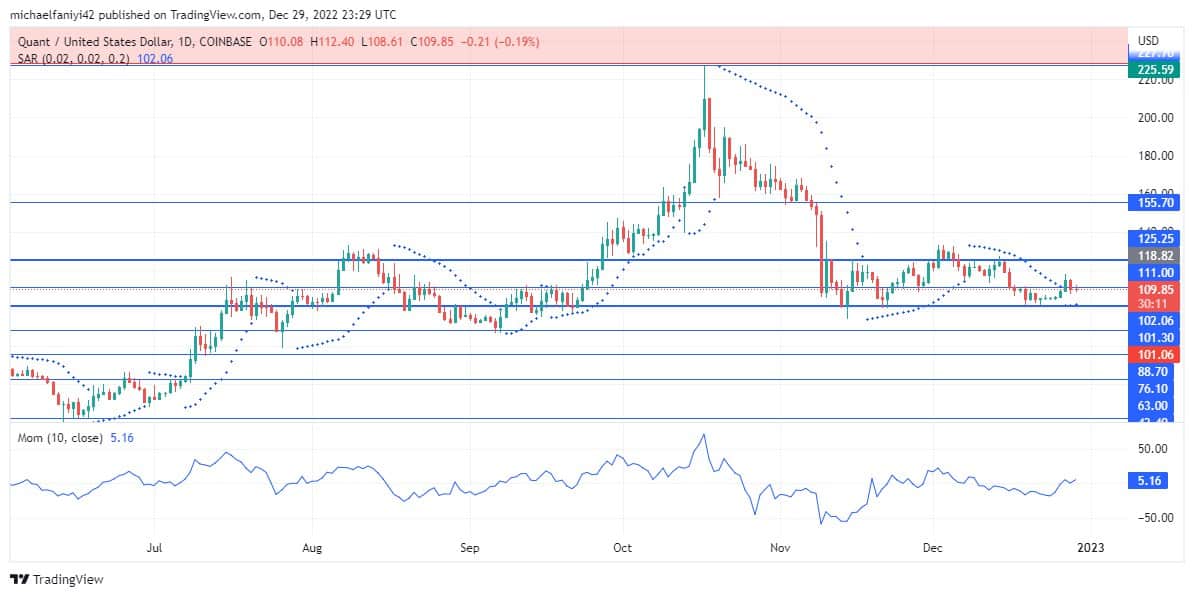
Quant Long-Term Trend: Bullish (1-Day Chart)
Key Levels:
Zones of supply: $111.00, $125.25, $227.70
Zones of Demand: $42.40, $88.70, $101.30

Quant is still locked in consolidation. This begins a new cycle as the coin rises off the $101.30 demand level. There is some resistance at the consolidation midline, but the market has overcome it to continue its rise. The coin is now expected to rise to test the resistance level before breaking through to the $227.70 resistance level.
Quant Price Forecast: QNT/USD Outlook
Quant continues its movement on a console. The price is about to start another cycle as the price bounced off the $101.30 demand level.
The market, however, encountered some resistance at the middle line of the consolidation, which is the $111.00 key level. As a result, the coin started a retracement.
QNTUSD has recovered from the retracement to continue its journey to the supply zone. The Parabolic SAR (Stop and Reverse) is unaffected by the retracement and keeps signifying a rise.
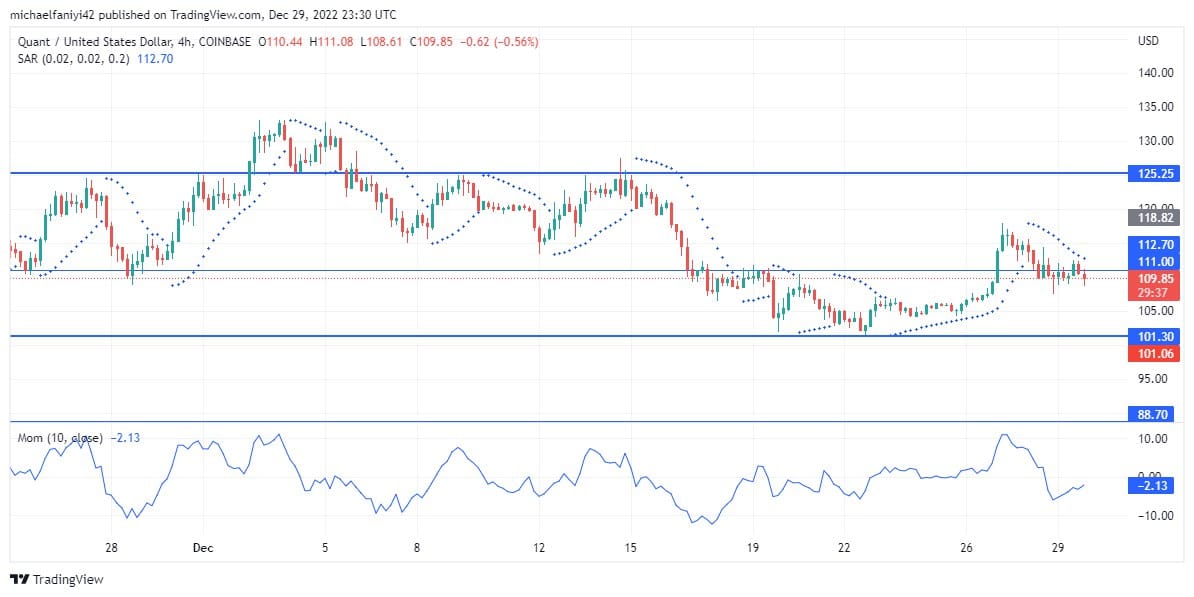
QNT/USD Medium-Term Trend: Bullish (4-hour chart)
The Momentum indicator line on the daily chart shows a sign of downturn at its tip as the price pulled back, but it has thus far adjusted itself back upward with the emergence of a bullish candlestick. The effect of the pullback on the 4-hour chart is more pronounced as the Momentum line drops from positive to negative, but this has been stabilized and the moment is rising again.

The Parabolic SAR dots have reacted to the pullback on the 4-hour chart as well. The dots have arranged themselves above the 4-hour candlesticks. The parabolic SAR dots are set to switch below the candles now that the market has recovered from the $111.00 key level. When this occurs, it indicates that the price is firmly back on its uptrend movement toward the $125.25 resistance to break out.
Place winning Quant trades with us. Get QNT here
Note: Learn2.trade is not a financial advisor. Do your research before investing your funds in any financial asset or presented product or event. We are not responsible for your investing results.
- Broker
- Min Deposit
- Score
- Visit Broker
- Award-winning Cryptocurrency trading platform
- $100 minimum deposit,
- FCA & Cysec regulated
- 20% welcome bonus of upto $10,000
- Minimum deposit $100
- Verify your account before the bonus is credited
- Fund Moneta Markets account with a minimum of $250
- Opt in using the form to claim your 50% deposit bonus
Learn to Trade
Never Miss A Trade Again

Signal Notification
Real-time signal notifications whenever a signal is opened, closes or Updated

Get Alerts
Immediate alerts to your email and mobile phone.

Entry Price Levels
Entry price level for every signal Just choose one of our Top Brokers in the list above to get all this free.


