Quant Price Forecast: November 21
Quant Long-Term Trend: Bullish (1-Day Chart)
Key Levels:
Zones of supply: $42.40, $88.70, $155.70
Zones of Demand: $222.70, $260.00, $352.10
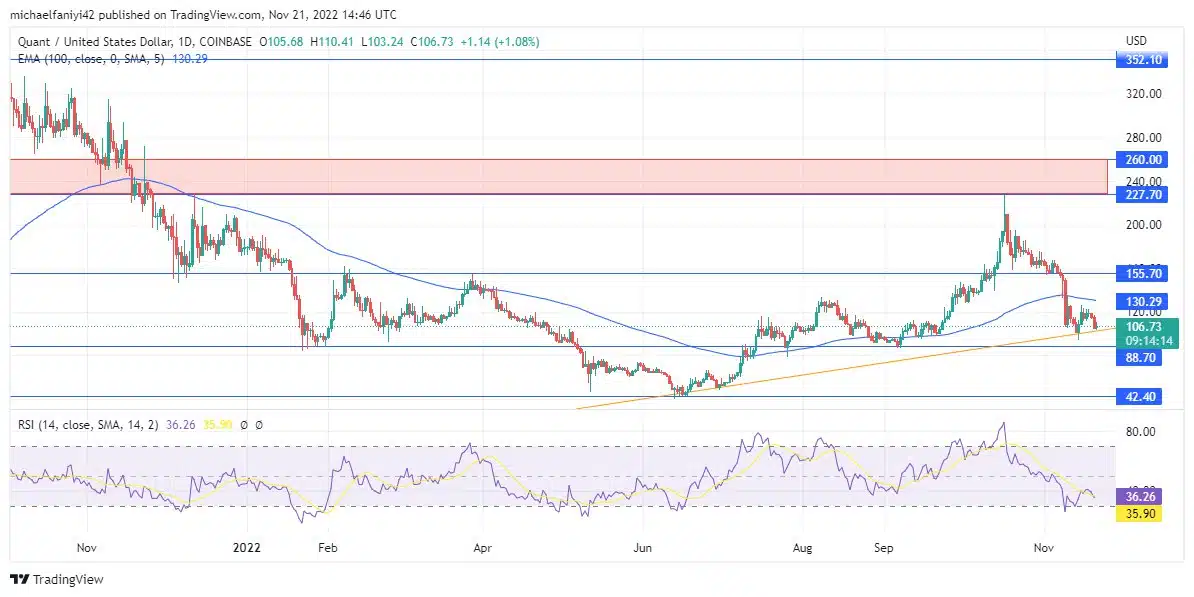
Quant is expected to maintain its steady upward trend. The market has been recovering nicely after a bearish period. The $42.40 support level is the point of reversal where the downtrend was stopped and where the coin began to make a recovery. Since then, QNTUSD has been making progress upward. If not for a harsh rejection at $222.70, the market would have probably risen even higher.
Quant Price Forecast: QNT/USD Outlook
The Quant market dipped unexpectedly and continuously till it reached the $42.40 demand, where the buyers were positioned to overthrow the market, which they did, taking control of it.
The coin immediately rose to the next support level of $88.70. The price attempted to spring even higher, but it met harsh resistance at $222.70. This doesn’t deter the bulls, though, and they keep making progress.
The effect of the rejection at $222.70 is demonstrated by the RSI (Relative Strength Index), whose line plunged back to the oversold border despite the market making a slightly higher low.
QNT/USD Medium-Term Trend: Bullish (4-hour chart)
The EMA period 100 (Exponential Moving Average) remains hanging above the daily candles as well as the 4-hour candles. It is expected that the price will eventually trade above the EMA as the coin continues to make upward progress.

Note: Learn2.trade is not a financial advisor. Do your research before investing your funds in any financial asset or presented product or event. We are not responsible for your investing results.