Don’t invest unless you’re prepared to lose all the money you invest. This is a high-risk investment and you are unlikely to be protected if something goes wrong. Take 2 minutes to learn more
Quant Price Forecast: February 25
The Quant price forecast indicates further bullish movement following a recent price surge. However, buyers must remain vigilant to sustain the momentum.
Quant Long-Term Trend: Bearish (1-Day Chart)
Key Levels:
Supply Levels: $120.95, $101.65
Demand Levels: $91.80, $73.00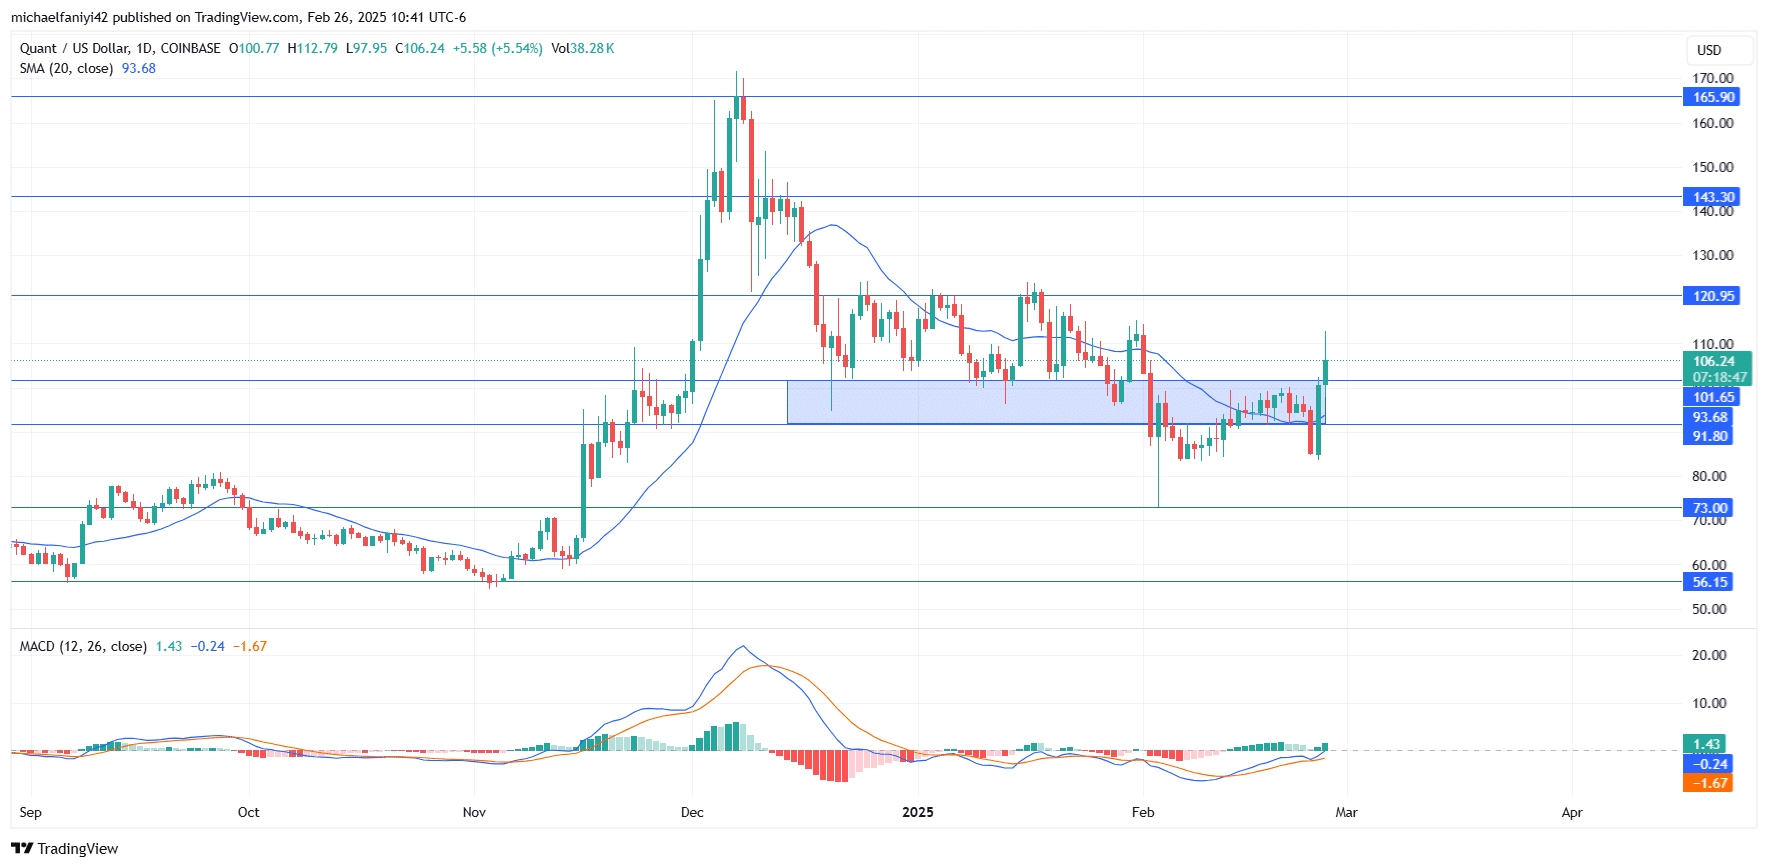
Quant Price Forecast: QNTUSD Outlook
Quant has been struggling under intense selling pressure since it dropped below the $101.65 key level.
However, since early February, buyers have become more proactive, leading to a price spike that pushed QNTUSD above the 20-period Moving Average and the $101.65 resistance level.
The MACD indicator reflects this bullish trend, with its lines crossing upward since mid-February. If this trajectory continues, the lines could move above equilibrium, reinforcing buyer confidence.
QNTUSD Medium-Term Trend: Bullish (4-Hour Chart)
On both the 4-hour and daily charts, the 20-period Moving Average played a crucial role as support until a significant drop pushed the price below $91.80. However, the recent surge has reignited bullish sentiment, driving the market back above the Moving Average and into the previous consolidation range.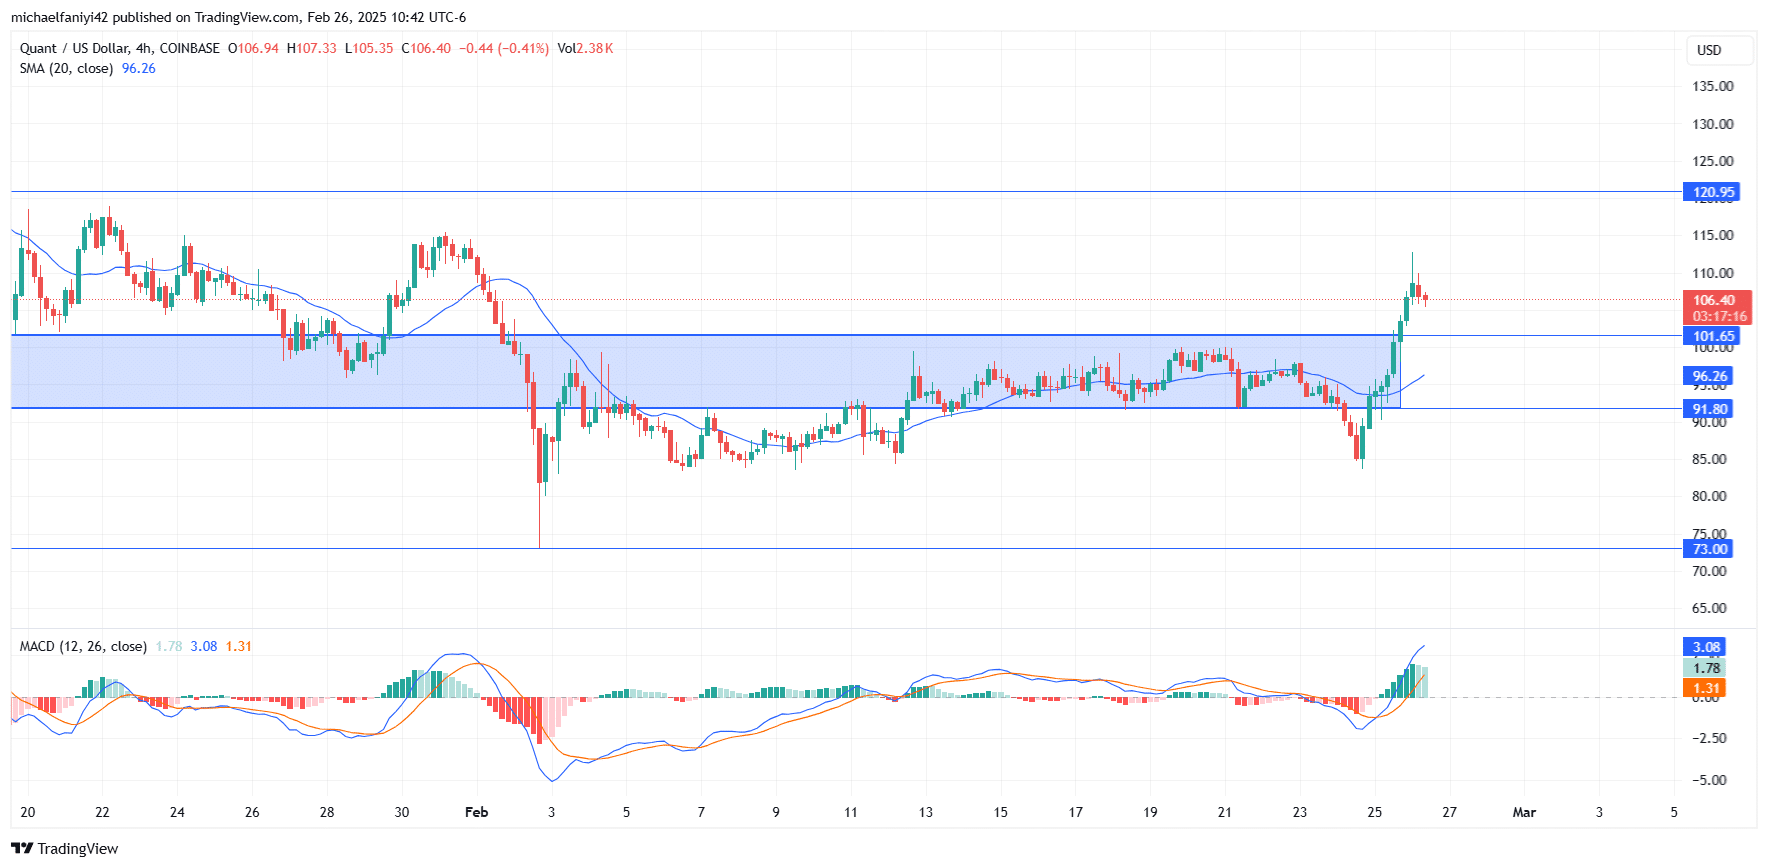
Make money without lifting your fingers: Start using a world-class auto trading solution
How To Buy Lucky Block – Guide, Tips & Insights | Learn 2 Trade
Note: Learn2.trade is not a financial advisor. Do your research before investing your funds in any financial asset, product, or event. We are not responsible for your investment results.
- Broker
- Min Deposit
- Score
- Visit Broker

- Award-winning Cryptocurrency trading platform
- $100 minimum deposit,
- FCA & Cysec regulated

- 20% welcome bonus of upto $10,000
- Minimum deposit $100
- Verify your account before the bonus is credited
- Fund Moneta Markets account with a minimum of $250
- Opt in using the form to claim your 50% deposit bonus
Learn to Trade
Never Miss A Trade Again

Signal Notification
Real-time signal notifications whenever a signal is opened, closes or Updated

Get Alerts
Immediate alerts to your email and mobile phone.

Entry Price Levels
Entry price level for every signal Just choose one of our Top Brokers in the list above to get all this free.