
QNTUSD Price Forecast – July 29th
The QNTUSD price forecast shows a fierce battle between bulls and bears.
QNTUSD Long Term Trend: Bullish (1-Day Chart)
Key Levels
Resistance Zones: $81.620, $76.000
Support Zones: $68.220, $64.000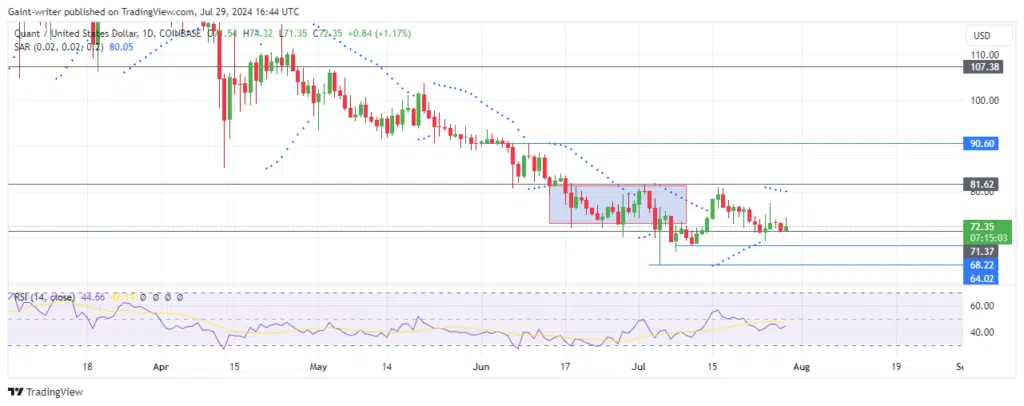
QNTUSD Price Forecast – Quant Outlook
The Quant buying force played out before encountering renewed selling pressure that pushed the price back towards the $71.370 level. Currently, buyers are engaged in a defensive struggle to maintain their position, while sellers remain poised to capitalize on any weakness.
The Relative Strength Index (RSI) hovering below the midpoint indicates that bearish momentum is still prevalent. Furthermore, the Parabolic SAR (Stop and Reverse) indicator continues its downward trajectory, suggesting that the overall market trend remains tilted in favor of sellers.
For QNTUSD to embark on a sustained uptrend, buyers must decisively overcome the $71.370 resistance and demonstrate sustained buying pressure. Until then, the market is likely to remain volatile and susceptible to rapid price swings.
QNTUSD Medium Term Trend: Bullish (4-hour)
Make money without lifting your fingers: Start using a world-class auto trading solution
How To Buy Lucky Block
Note: Learn2.trade is not a financial advisor. Do your research before investing your funds in any financial asset, product, or event. We are not responsible for your investment results.


