

Quant Price Forecast: December 16
Quant Long-Term Trend: Bullish (1-Day Chart)
Key Levels:
Zones of supply: $155.70, $222.70
Zones of Demand: $42.40, $88.70
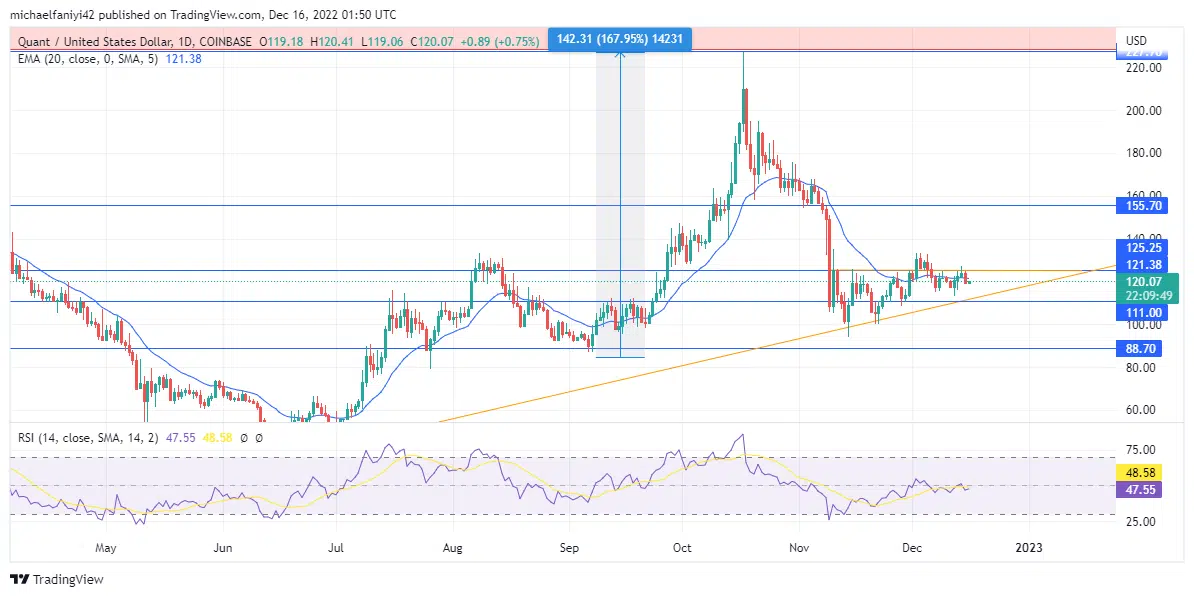
Quant buyers ahttps://learn2.trade/quant-price-forecast-qntusd-is-exerting-pressure-upward-to-the-125-25-supply-levelre still in charge of the market. The entire price structure hinges in their favor. However, the bulls aren’t just after another start-and-stop movement; they want the price to be able to drive through the opposing key levels to reach a high price level. Hence the need for price consolidation in an ascending triangle pattern.
Quant Price Forecast: QNT/USD Outlook
The QNTUSD buyers remain in charge of the market. Furthermore, they are attempting to generate momentum for the coin to drive through the key levels and to higher prices.
The consolidation period through the bullish triangle structure is now reaching its maturity stage. The market is now knocking against the $125.25 resistance level; as the price is piercing through points of weakness.
Though the price is currently trading below it, the EMA period 20 (Exponential Moving Average) has likewise been broken into at intervals, but the candlesticks generally remain below the indicator line.
QNT/USD Medium-Term Trend: Bullish (4-hour chart)
The RSI (Relative Strength Index) is a major market indicator, and since the turn of this new year, the line has been fluctuating about the middle line, having previously bounced off the border of the oversold level.

There is little difference between the lower timeframe and the daily time frame. The market is still trading below the EMA period 20. While the RSI shows that the buyers have taken a huge stride upward, which is reflected in the candles putting pressure on the $125.25 resistance. The market is expected to eventually break out and ride toward $227.70.
Note: Learn2.trade is not a financial advisor. Do your research before investing your funds in any financial asset or presented product or event. We are not responsible for your investing results.


