

Quant Price Forecast: February 10
Quant Long-Term Trend: Bullish (1-Day Chart)
Key Levels:
Zones of supply: $155.70, $227.70
Zones of Demand: $101.30, $125.25
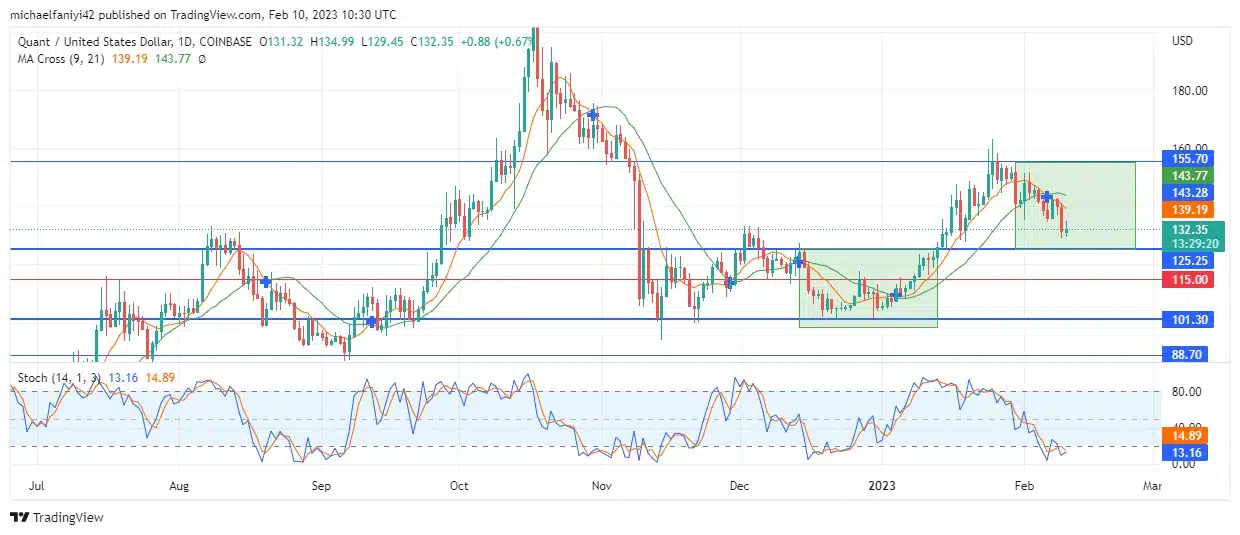
The Quant market has continued its agenda of sliding towards the $125.25 demand zone, where it is expected to be triggered back upward. Currently, the market is oversold and close to the demand level, allowing more buyers to enter the market. The coin is poised for an imminent rise from its current oversold state.
Quant Price Forecast: QNT/USD Outlook
Quant is still following its course of dropping down to a lower price level towards the $125.25 weekly support level. This comes after the price was unable to rise beyond the $155.70 barrier.
Currently, the market has traded close to the $125.25 support level, and more buyers are preparing to jump into the market at the reduced price level. This will help to pump the market higher once it begins its ascent.
Due to the movement to a lower price level, the Stochastic Oscillator lines have dropped to the border of the overbought region. The market is expected to rise anytime soon.
QNT/USD Medium-Term Trend: Bullish (4-hour chart)
The MA Cross (Moving Average) on the daily chart has just crossed downward as a confirmation of the current pullback of the market to a lower price level. Meanwhile, there have been multiple downward crosses by the MA on the 4-hour chart.

The Stochastic Oscillator lines were undulating wildly from the overbought to the oversold region until about yesterday when they no longer rose above the middle line of the chart. The market anticipation is that buyers will begin to troop in to influence the coin at the $125.25 demand level. From here, the price is expected to skyrocket back to the $155.70 resistance.
Note: Learn2.trade is not a financial advisor. Do your research before investing your funds in any financial asset or presented product or event. We are not responsible for your investing results.


