

Quant Price Forecast: January 26
The Quant price forecast is that the market will continue to haggle over the weekly resistance level until it gives way.
Quant Long-Term Trend: Bullish (1-Day Chart)
Key Levels:
Zones of supply: $155.70, $227.70, $260.00
Zones of Demand: $101.30, $115.00, $125.25
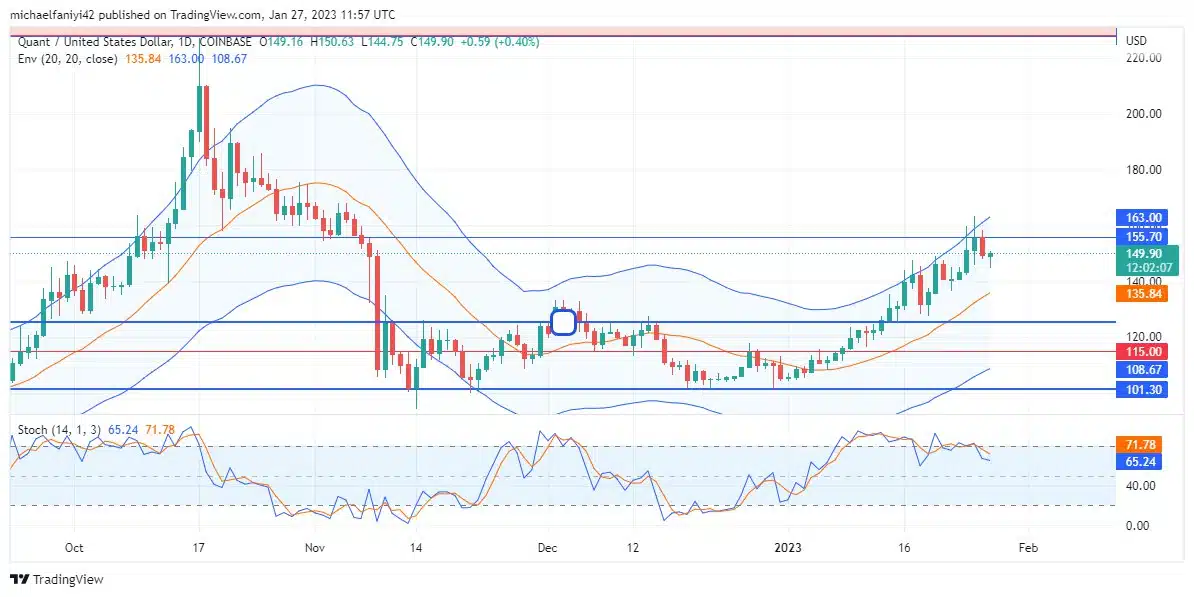
The Quant buyers are relentless in their pursuit of higher price levels. It has been evident in the progress the coin has made thus far. The $155.70 resistance level is resisting the price rise, but it is only a matter of time before the bulls find the weak point to exploit to rise higher.
Quant Price Forecast: QNT/USD Outlook
Quant remains determined to break through the weekly resistance level at $155.70. The QNTUSD price seeks to break over the barrier mark.
The market has broken free from the shackles of the consolidation zone, and it remains as pumped up as ever to keep going on upward.
The $155.70 resistance has withstood the price rise, but it is only a matter of time before a breakout. The upper line of the Envelope indicator stretches out as the price keeps plowing through the resistance level.
QNT/USD Medium-Term Trend: Bullish (4-hour chart)
Since the breakout from the consolidation confinement, the Stochastic Oscillator lines on the daily chart have risen from oversold into overbought territory and have not dropped since. However, it is hovering above the oversold border on the 4-hour chart, ready for another upthrust as the price prepares to test the resistance again.

Meanwhile, the 4-hour candles are currently resting on the middle line of the Envelope indicator, from which they keep rising to test the $155.70 resistance level. However, there is enough determination and momentum among buyers to breach the $155.70 resistance level.
Note: Learn2.trade is not a financial advisor. Do your research before investing your funds in any financial asset or presented product or event. We are not responsible for your investing results.


