Don’t invest unless you’re prepared to lose all the money you invest. This is a high-risk investment and you are unlikely to be protected if something goes wrong. Take 2 minutes to learn more
PUMP/USD Price Analysis – Pump Token Compresses Near $0.002560 With Momentum Tilting Bearish
Pump (PUMP/USDT) has been trading in a tight range below the $0.00260 pivot, with price action showing signs of seller dominance. After multiple failed attempts to reclaim the $0.00265 zone, price has compressed into a narrow band, suggesting liquidity build-up and potential for directional expansion. Momentum indicators are turning bearish, and traders are watching for signs of a breakdown or trap reversal.
PUMP/USD Daily Key Levels:
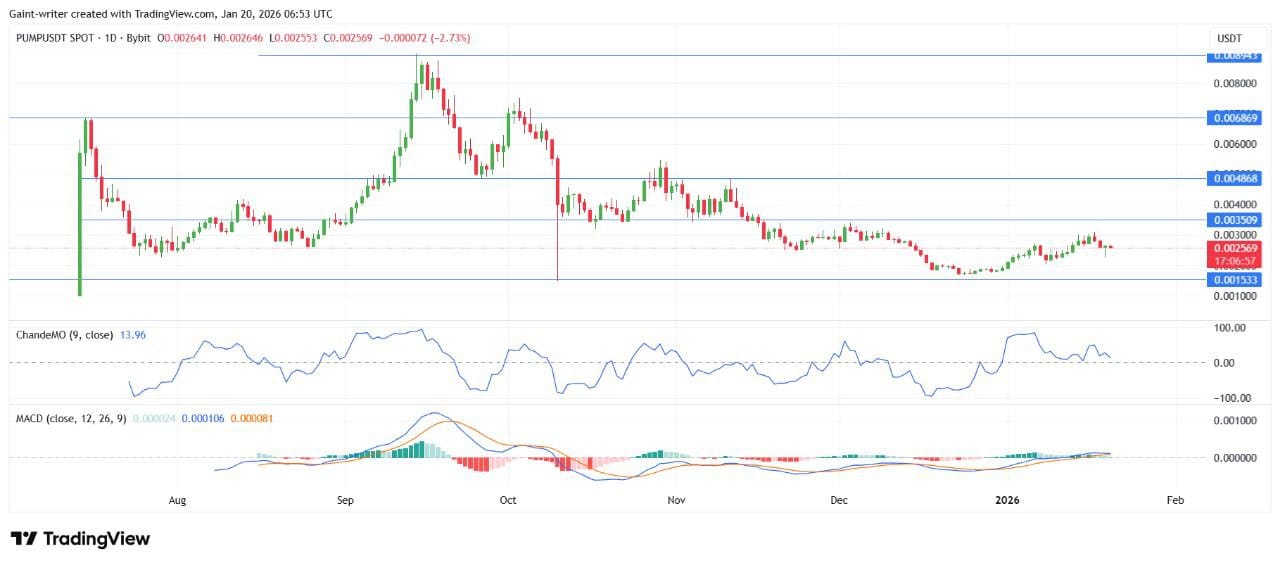
Support Zones: $0.001530, $0.00210
Resistance Zones: $0.003500, $0.004860
PUMPUSD Long Term Trend- Bearish (Daily Chart)
PUMP/USD is currently trading at $0.002560, down 2.73% on the day. The Chande Momentum Oscillator is soft at 13.96, indicating fading bullish pressure. The MACD histogram remains positive at 0.000081, but the MACD line is below the signal line, suggesting weakening trend strength.
Price action is compressing beneath the $0.00260–$0.00265 zone, which has acted as a short-term supply shelf. Multiple upper wicks and small-bodied candles reflect seller aggression and buyer hesitation. If bulls fail to reclaim $0.00260 with conviction, a slide toward $0.00230 and $0.001530 becomes increasingly likely. Traders are likely to remain reactive, watching for a decisive candle close above $0.00265 or below $0.00253 to confirm the next impulse.
PUMP Tops Out – Smart Exit Before 27% Crash
Kirsanovtrade nailed the Elliott Wave 5 top, exited longs near the peak, and watched $PUMP drop 27% exactly to the 0.618 Fib retracement. Cycle complete; reset phase now.
$PUMP as expected, the correction started immediately after the completion of wave 5. That’s why the exit was taken near the top, without trying to catch the absolute high. At the extreme of a fifth wave, upside momentum is typically exhausted: late longs get trapped and smart… https://t.co/JNVgdrcgXepic.twitter.com/9egq6xqiqR
On the 4H chart, PUMP/USD is showing signs of intraday weakness. Price is currently trading at $0.002569, down 1.00%, with candles forming long upper wicks and lower closes. The Chande Momentum Oscillator is bearish at -27.55, while the MACD histogram is negative at -0.000038, confirming short-term bearish momentum.
The market is ranging between $0.002553 and $0.002617, with liquidity clustering near the $0.00256–$0.00260 zone. This area may act as a short-term order block. If price breaks below $0.00253 with acceptance, a sweep toward $0.00230 or lower is likely crypto signal.
Note: Learn2.trade is not a financial advisor. Do your research before investing your funds in any financial asset, product, or event. We are not responsible for your investment results.
Trade on MT4 with Leverage up to 1:500! Trade on MT4 with Leverage up to 1:500!
X
We use cookies to ensure that we give you the best experience on our website. If you continue to use this site we will assume that you are happy with it.