

Polygon price may decrease further
Polygon (MATICUSD) Price Analysis – 24 April
The $0.87 and $0.76 support levels might be reached if Polygon breaks through the $0.98 support level. The price may advance past the $1.01 resistance level and be exposed to the $1.12 and $1.20 levels if buyers are successful in combining more force.
Key Levels:
Resistance levels: $1.01, $1.12, $1.20
Support levels: $0.98, $0.87, $0.76
MATIC/USD Long-term Trend: Bearish
MATIC/USD is bearish in the long-term outlook. The pressure from the sellers is more than that of the purchasers and this caused the breakdown of the former support level of $1.12. Last two weeks, the price was trading around $1.12 levels. The resistance level of $1.20 holds and the bulls could not gain enough momentum to break up the level. More pressure from the bears declined the price below the $1.01 support level. The price is currently targeting the support level of $0.98.
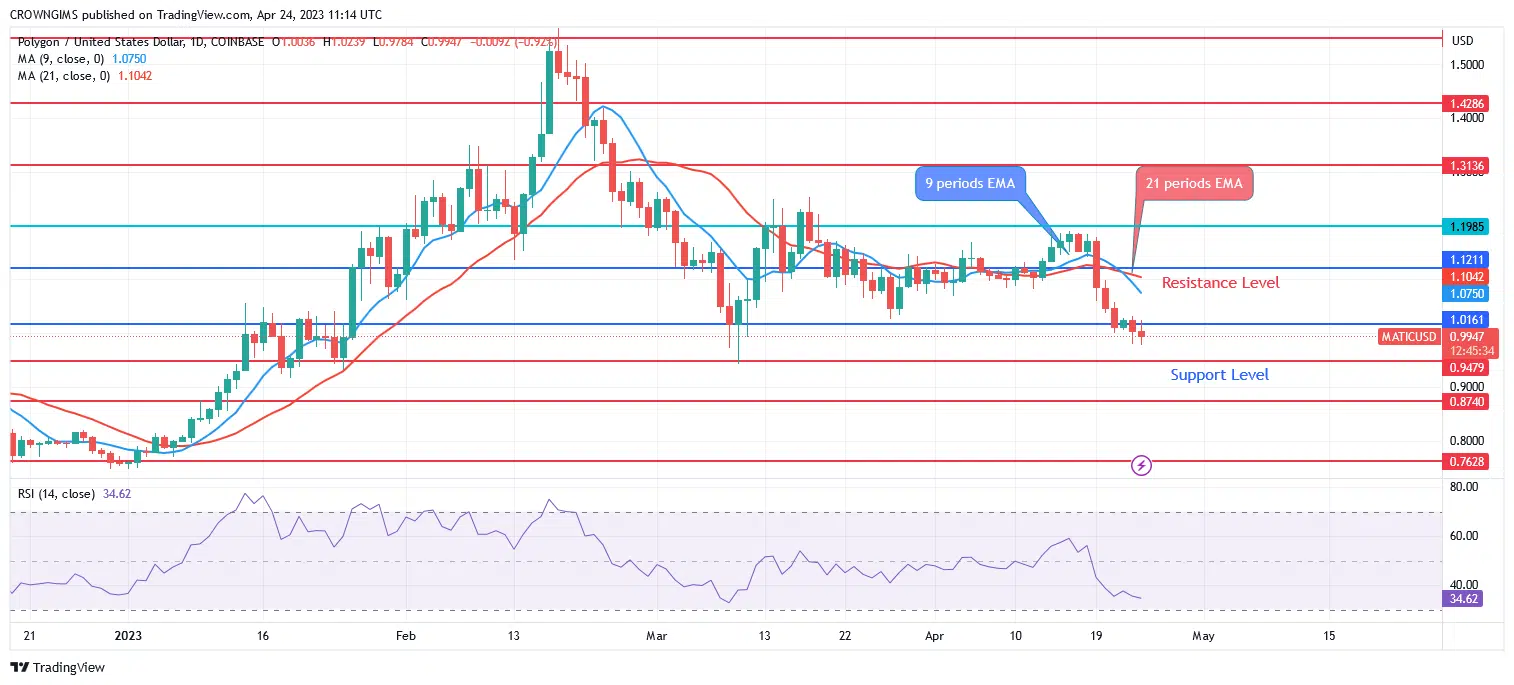
The fact that MATIC is currently trading below both the 9- and 21-period exponential moving averages suggests that the bears’ momentum is gaining strength. The $0.87 and $0.76 support levels might be reached if Polygon breaks through the $0.98 support level. The price may advance past the $1.01 resistance level and be exposed to the $1.12 and $1.20 levels if buyers are successful in combining more force.
MATIC/USD Short-term Trend: Bearish
Polygon is on the bearish movement in 4-hour time-frame. The MATIC market has been under the thumb of bears for the last three weeks. On March 13, the $1.19 resistance level resisted the price increase. The price was driven to move closer to the $1.01 threshold by additional downward pressure. Passing the $1.01 level, the initial goal was completed. Currently, prices on the MATIC market are below $1.01 level.

The price of Polygon is currently below the two EMAs. The 9-day EMA has crossed below the 21-period EMA. The signal line for period 14 of the relative strength index is going upward at 35 levels which may be a pullback.
You can purchase Lucky Block here. Buy LBLOCK


