Bears are dominating Polygon market
Polygon (MATICUSD) Price Analysis – 24 July
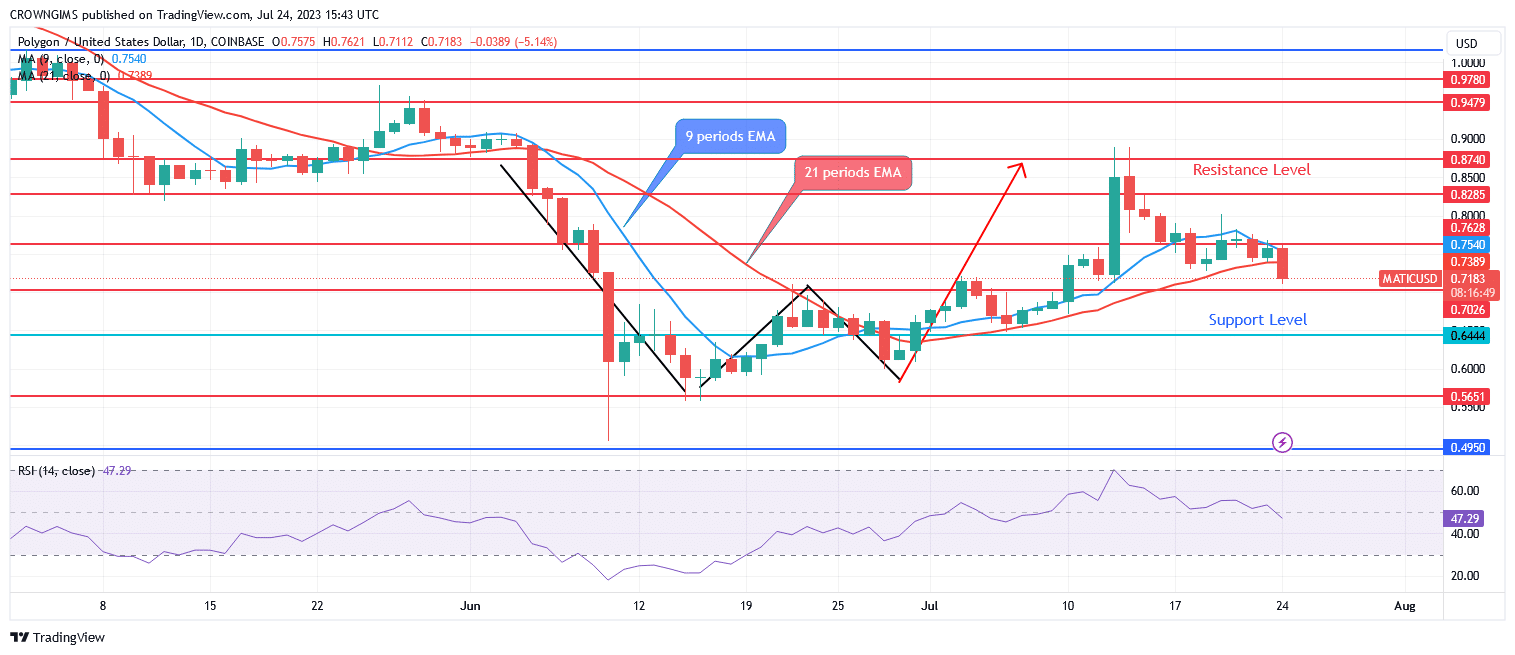
Polygon must first get through the $0.76 resistance level before attempting to cross the $0.82 and $0.87 resistance levels. The market may move past the $0.70 support level and be exposed to the $0.64 and $0.56 levels if sellers are successful in unifying their forces.
Key Levels:
Resistance levels: $0.76, $0.82, $0.87
Support levels: $0.70, $0.64, $0.56
MATIC/USD Long-term Trend: Bearish
The outlook for MATIC/USD over the long run is bearish. The target of the price action, the double bottom chart pattern was achieved. In other words, the price reached the resistance level of $0.87 last week. The bullish momentum failed and the bears gained more power to drive the price down towards the previous low. Polygon is heading toward $0.70 support level at the moment.
MATIC/USD Short-term Trend: Bearish
Polygon is on a bearish movement on a 4-hour time horizon. When the double bottom chart pattern appeared at the support level of $0.56, bulls took control of the Polygon market. The resistance level of $0.87 was tested as the price rose. For the past two weeks, that was our goal. The price declined and is currently attempting to fall below the $0.70 support level.
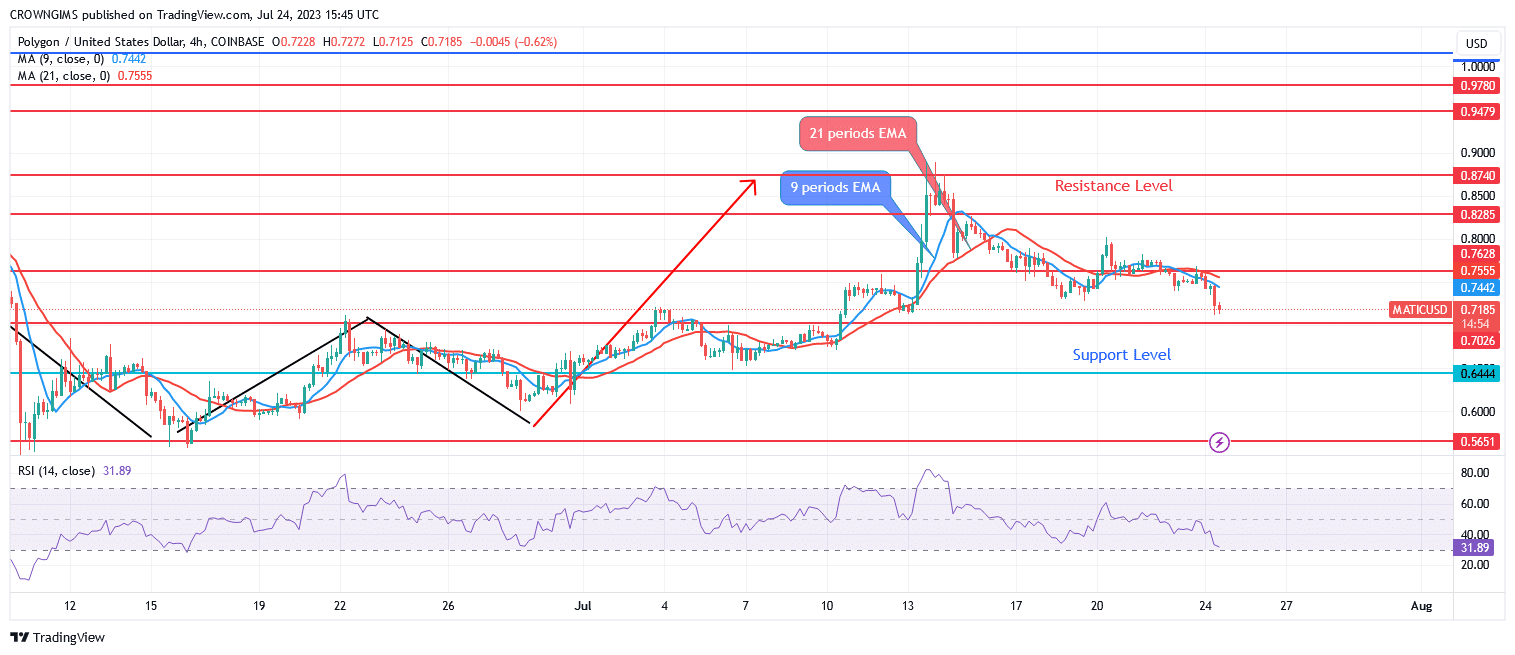
The price of Polygon is trading below the two EMAs. The 9-period EMA has crossed the 21-day EMA downside. The relative strength index’s period 14 signal line is pointing downward at level 32, signaling a sell.
You can purchase Lucky Block – Guide, Tips & Insights | Learn 2 Trade here. Buy LBLOCK
- Broker
- Min Deposit
- Score
- Visit Broker

- Award-winning Cryptocurrency trading platform
- $100 minimum deposit,
- FCA & Cysec regulated

- 20% welcome bonus of upto $10,000
- Minimum deposit $100
- Verify your account before the bonus is credited
- Fund Moneta Markets account with a minimum of $250
- Opt in using the form to claim your 50% deposit bonus
Learn to Trade
Never Miss A Trade Again

Signal Notification
Real-time signal notifications whenever a signal is opened, closes or Updated

Get Alerts
Immediate alerts to your email and mobile phone.

Entry Price Levels
Entry price level for every signal Just choose one of our Top Brokers in the list above to get all this free.