

Polygon price is targeting $0.82 level
Polygon (MATICUSD) Price Analysis – 03 July
Before crossing the $0.76 and $0.82 resistance levels, Polygon must first overcome the $0.70 resistance level. If sellers are successful in uniting their forces, the market may move past the $0.64 support level and be exposed to the $0.49 and $0.40 levels.
Key Levels:
Resistance levels: $0.70, $0.76, $0.82
Support levels: $0.64, $0.49, $0.40
MATIC/USD Long-term Trend: Bullish
The outlook for MATIC/USD over the long run is favorable. After the $1.31 rejection, bears placed more pressure on prices than buyers did. When it approached the $0.82 support level, the price was still under bearish pressure. The sellers were no longer in a position to bargain for a cheaper price. Last two weeks, as sellers’ pressure dropped below $0.64, the price dropped to $0.49 before rebounding again. Last week, the purchasers drove the price to test $0.70. It is currently struggling to break up just mentioned level.
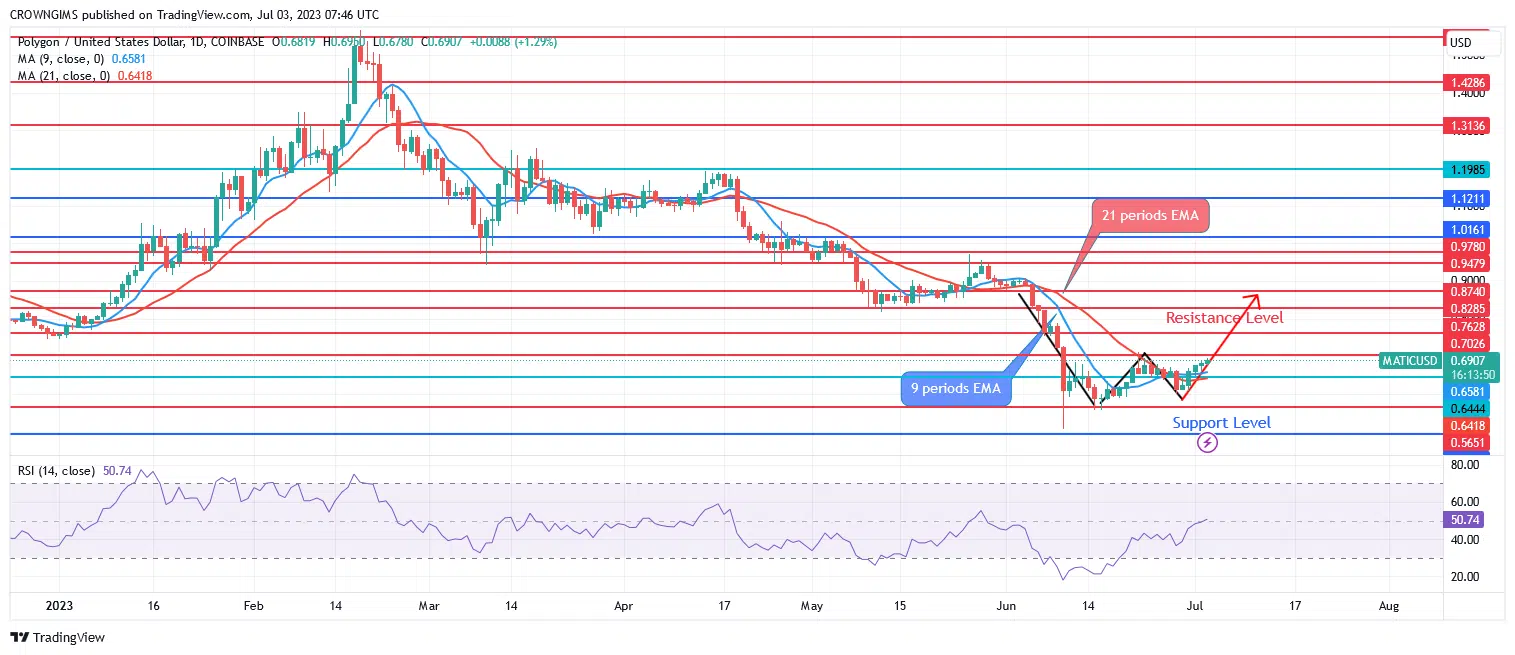
Buying is suggested as MATIC is currently trading above the 9- and 21-period exponential moving averages. Before crossing the $0.76 and $0.82 resistance levels, Polygon must first overcome the $0.70 resistance level. If sellers are successful in uniting their forces, the market may move past the $0.64 support level and be exposed to the $0.49 and $0.40 levels.
MATIC/USD Short-term Trend: Bullish
On a 4-hour time horizon, Polygon is on a bullish movement. The MATIC market has been under the thumb of bears for more than five weeks. The cost decreased further, approaching $0.87. The main goal was achieved at $0.82, but it also successfully broke the level and tried $0.49. It retreated after being challenged at the $0.49 support level and is currently bouncing up toward the resistance level of $0.70.

The price of Polygon is trading above the two EMAs. The 9-period EMA has crossed the 21-day EMA. The relative strength index’s period 14 signal line is pointing upward at level 50, signaling a buy.
You can purchase Lucky Block here. Buy LBLOCK


