Polygon is struggling to penetrate $0.93 resistance level
Polygon (MATICUSD) Price Analysis – October 31
An increase in the bulls’ pressure may push the coin to break up the resistance level of $0.93 and Polygon may increase further to $1.01 and $1.18 levels. In case the resistance level at $0.93 holds, Polygon may decline to $0.87 level, bearish momentum extend to the $0.76 level and $0.70.
Key Levels:
Resistance levels: $0.93, $1.01, $1.18
Support levels: $0.87, $0.76, $0.70,
MATIC/USD Long-term Trend: Bullish
MATIC/USD price is on the bullish trend on the Long-term outlook. The crypto did not make tangible movement last week. When the price bounced up from the support level of $0.70. The price increases and break up the former resistance levels of $0.76 and $0.87. The price tested the resistance level of $0.93 last week. The price is trying to break up the resistance level of $0.93.
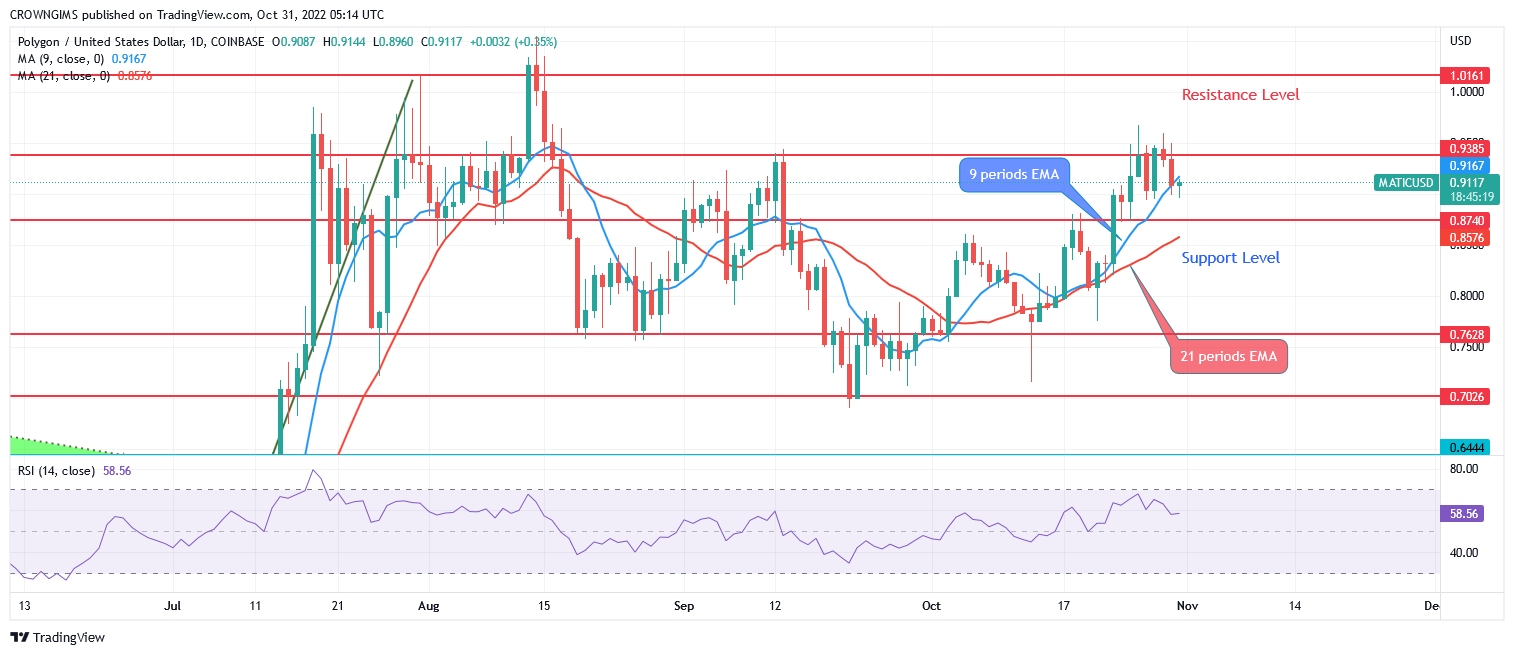
Polygon is trading above the 9 periods EMA and 21 periods EMA, which indicate a bullish movement in Polygon market. An increase in the bulls’ pressure may push the coin to break up the resistance level of $0.93 and Polygon may increase further to $1.01 and $1.18 levels. In case the resistance level at $0.93 holds, price may decline to $0.87 level, bearish momentum extend to the $0.76 level and $0.70.
MATIC/USD Short-term Trend: Bearish
Polygon is bearish on the medium-term outlook. The crypto was on bullish trend last week, the price has increased to test the resistance level of $0.93. Attempts has been made to penetrate the just mentioned level but the bears are opposing the movement. Sellers’ pressure is increasing at the moment and if this continue, price may retest the support level of $0.8740.
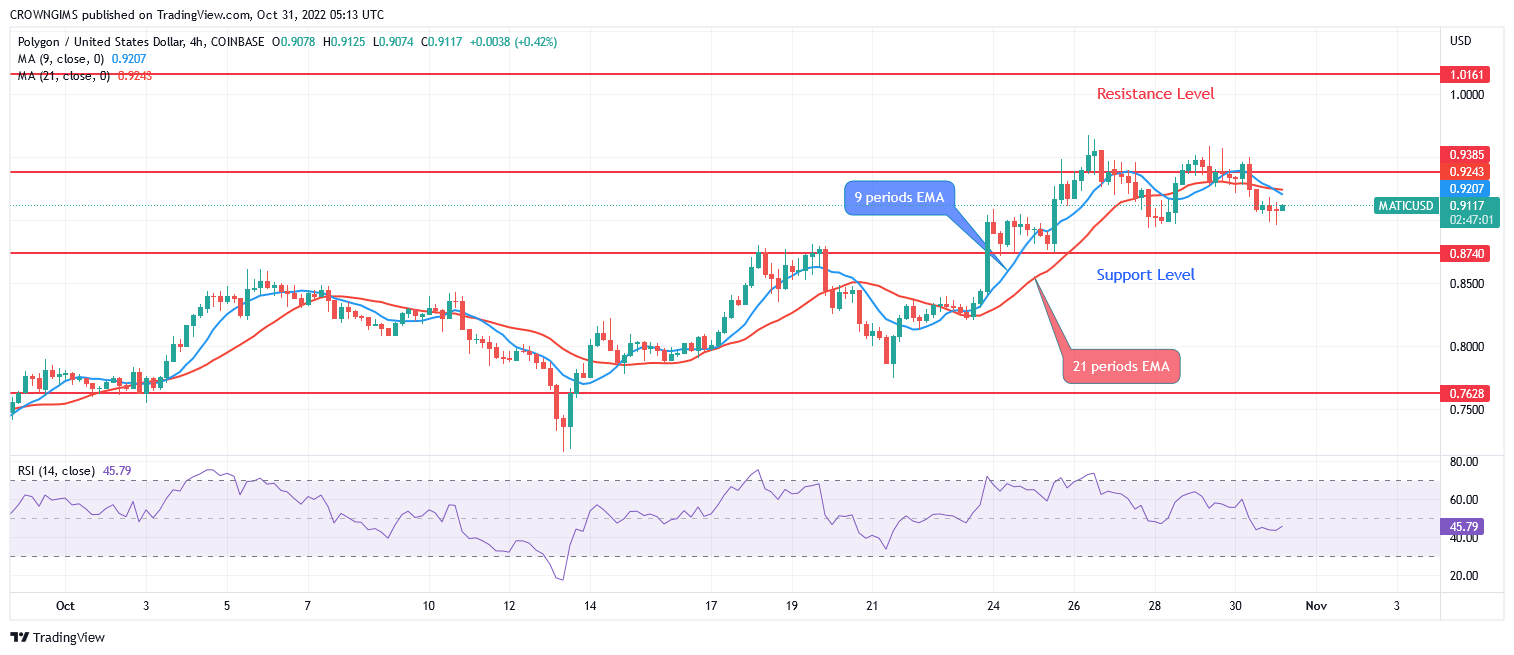
The 9-day EMA is below the 21 periods EMA and the Polygon price is trading below the two EMAs. The relative strength index period 14 is at 44 levels with the signal line pointing down to indicate sell signal.
You can purchase crypto coins here. Buy LBLOCK
- Broker
- Min Deposit
- Score
- Visit Broker

- Award-winning Cryptocurrency trading platform
- $100 minimum deposit,
- FCA & Cysec regulated

- 20% welcome bonus of upto $10,000
- Minimum deposit $100
- Verify your account before the bonus is credited
- Fund Moneta Markets account with a minimum of $250
- Opt in using the form to claim your 50% deposit bonus
Learn to Trade
Never Miss A Trade Again

Signal Notification
Real-time signal notifications whenever a signal is opened, closes or Updated

Get Alerts
Immediate alerts to your email and mobile phone.

Entry Price Levels
Entry price level for every signal Just choose one of our Top Brokers in the list above to get all this free.