Polygon (MATICUSD) Price Analysis – August 08
In case the resistance level of $1.01 is broken upside, the resistance level at $1.18 price level may be reached and penetrated to test the $1.31. Should the bears oppose bulls at the resistance level of $1.01, the price may reverse and continue a bearish trend to $0.91, $0.74 and $0.55 levels.
Key Levels:
Resistance levels: $1.01, $1.18, $1.31
Support levels: $0.91, $0.74, $0.55
MATIC/USD Long-term Trend: Bullish
MATIC/USD price is on the bullish trend on the Long-term outlook. Our bullish target on the daily chart when the bullish chart pattern formed was reached at $1.01 on July 31. The bears defended the just mentioned level and pulled back to retest the support level of $0.91. Price consolidates around the just mentioned level for few days. At the moment, the bulls are gaining more momentum price is increasing towards the previous high at $1.01 level.
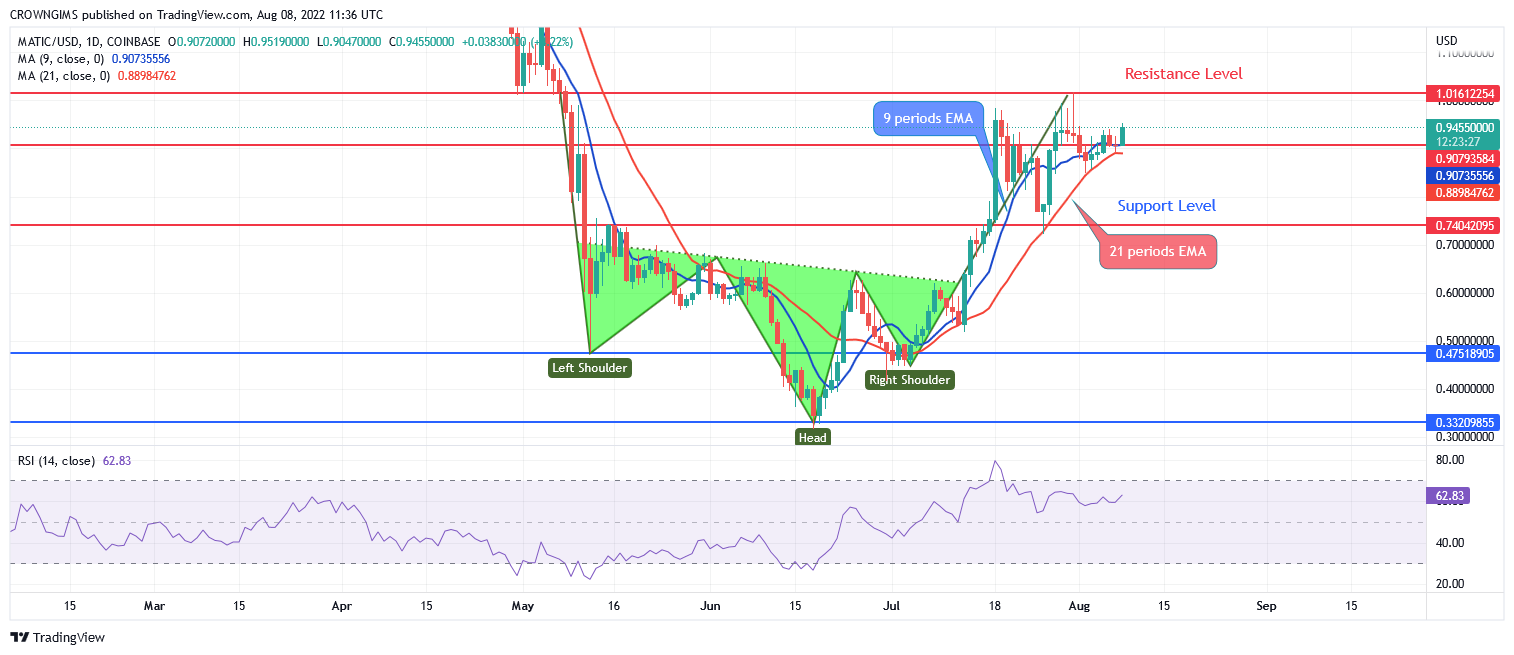
Polygon is trading above the 9 periods EMA and 21 periods EMA. Further increase in the Polygon price is highly envisaged. In case the resistance level of $1.01 is broken upside, the resistance level at $1.18 price level may be reached and penetrated to test the $1.31. Should the bears oppose bulls at the resistance level of $1.01, the price may reverse and continue a bearish trend to $0.91, $0.74 and $0.55 levels.
MATIC/USD Short-term Trend: Bullish
Polygon is bullish on the medium-term outlook. The price pulled back after tested the resistance level of $1.01 on July 28. The support level of $0.74 was retested on July 26. The bullish engulfing candle pattern formed restored the bullish movement towards the resistance level of $1.01 level. Bullish trend may continue as more bullish candles are produced.
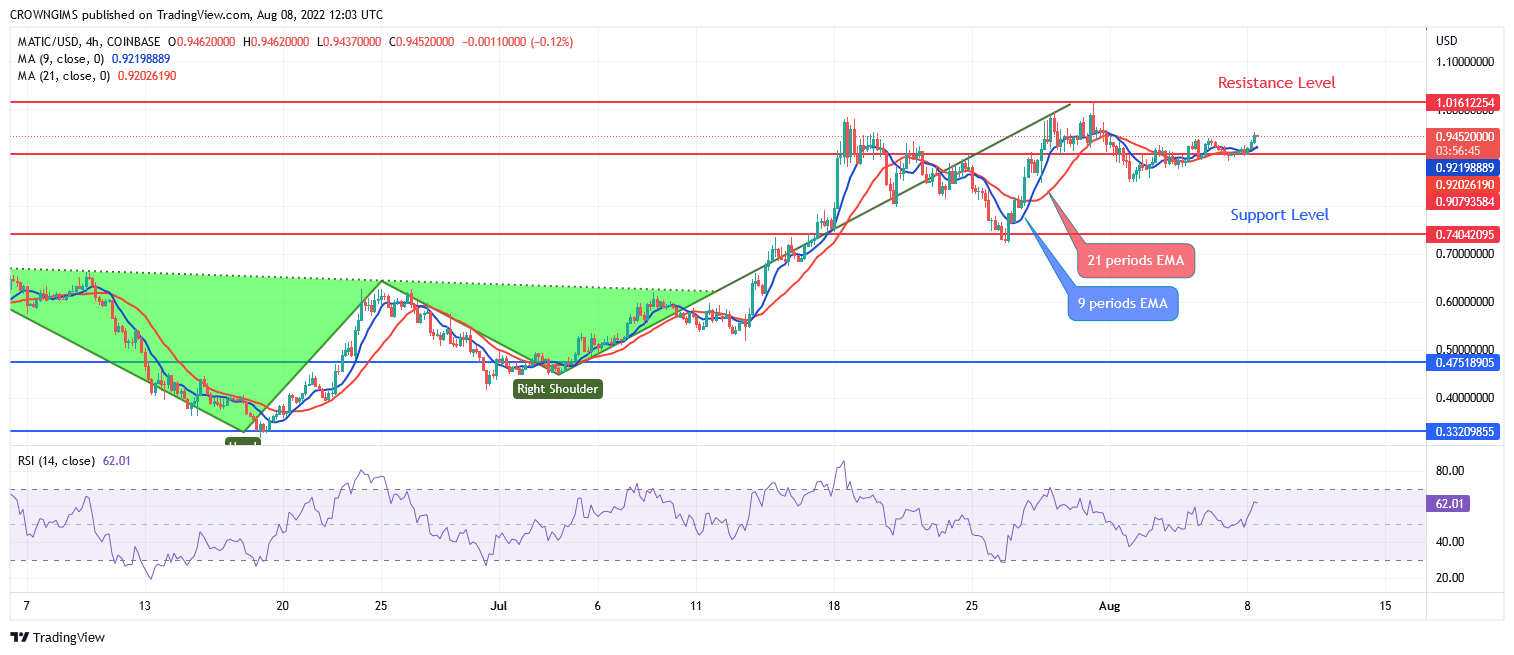
The 9-day EMA is above the 21 periods EMA and the Polygon price is trading above the two EMAs at distance which indicates a bullish movement. However, the relative strength index period 14 is at 63 levels with the signal line pointing up to connote buy signal.
- Broker
- Min Deposit
- Score
- Visit Broker

- Award-winning Cryptocurrency trading platform
- $100 minimum deposit,
- FCA & Cysec regulated

- 20% welcome bonus of upto $10,000
- Minimum deposit $100
- Verify your account before the bonus is credited
- Fund Moneta Markets account with a minimum of $250
- Opt in using the form to claim your 50% deposit bonus
Learn to Trade
Never Miss A Trade Again

Signal Notification
Real-time signal notifications whenever a signal is opened, closes or Updated

Get Alerts
Immediate alerts to your email and mobile phone.

Entry Price Levels
Entry price level for every signal Just choose one of our Top Brokers in the list above to get all this free.